.svg)

Flutter's rendering model is deceptively elegant. Widgets compose into a tree, the framework diffs and repaints only what changes, and Dart's ahead-of-time compilation keeps startup snappy. In practice, though, elegance at the abstraction level doesn't guarantee efficiency at runtime. Jank creeps in through poorly scoped rebuilds, expensive layout passes in deep widget trees, and memory growth that only surfaces under sustained real-world usage. Identifying these issues requires more than reading code—it demands a live, instrumented view into what the engine is actually doing on a frame-by-frame basis.
Flutter DevTools is the official suite of performance and debugging tools built specifically for this purpose. It runs alongside your app in a connected browser tab or inside your IDE and surfaces data directly from the Dart VM and Flutter engine: frame timings, widget rebuild counts, memory allocations, CPU call stacks, and network traffic. Unlike general-purpose mobile profilers that operate at the OS layer, DevTools understands Flutter's own rendering pipeline—layers, raster threads, shader compilation, and Dart isolates—giving you signal that's actionable at the
framework level rather than just the system level.
This article is a detailed guide to using DevTools effectively in a production-grade Flutter project. It covers the internal architecture that makes profiling possible, the tooling surface across DevTools' core panels, advanced optimization patterns informed by real profiling data, and the common mistakes that lead engineers to misread or underuse the toolset. If you're debugging frame drops, memory leaks, or startup latency in a shipping Flutter app, this is the reference.
Foundational Concept: How Flutter's Rendering Pipeline Exposes Performance Data
Understanding what DevTools shows requires a working model of how Flutter renders a frame. When your app calls setState, or a stream pushes new data, Flutter schedules a frame. That frame goes through three distinct phases: build, layout, and paint. The build phase reconstructs the widget subtree that's marked dirty. Layout computes sizes and positions. Paint walks the render object tree and emits drawing commands into a Layer tree. Finally, the engine's raster thread composites those layers onto the GPU.
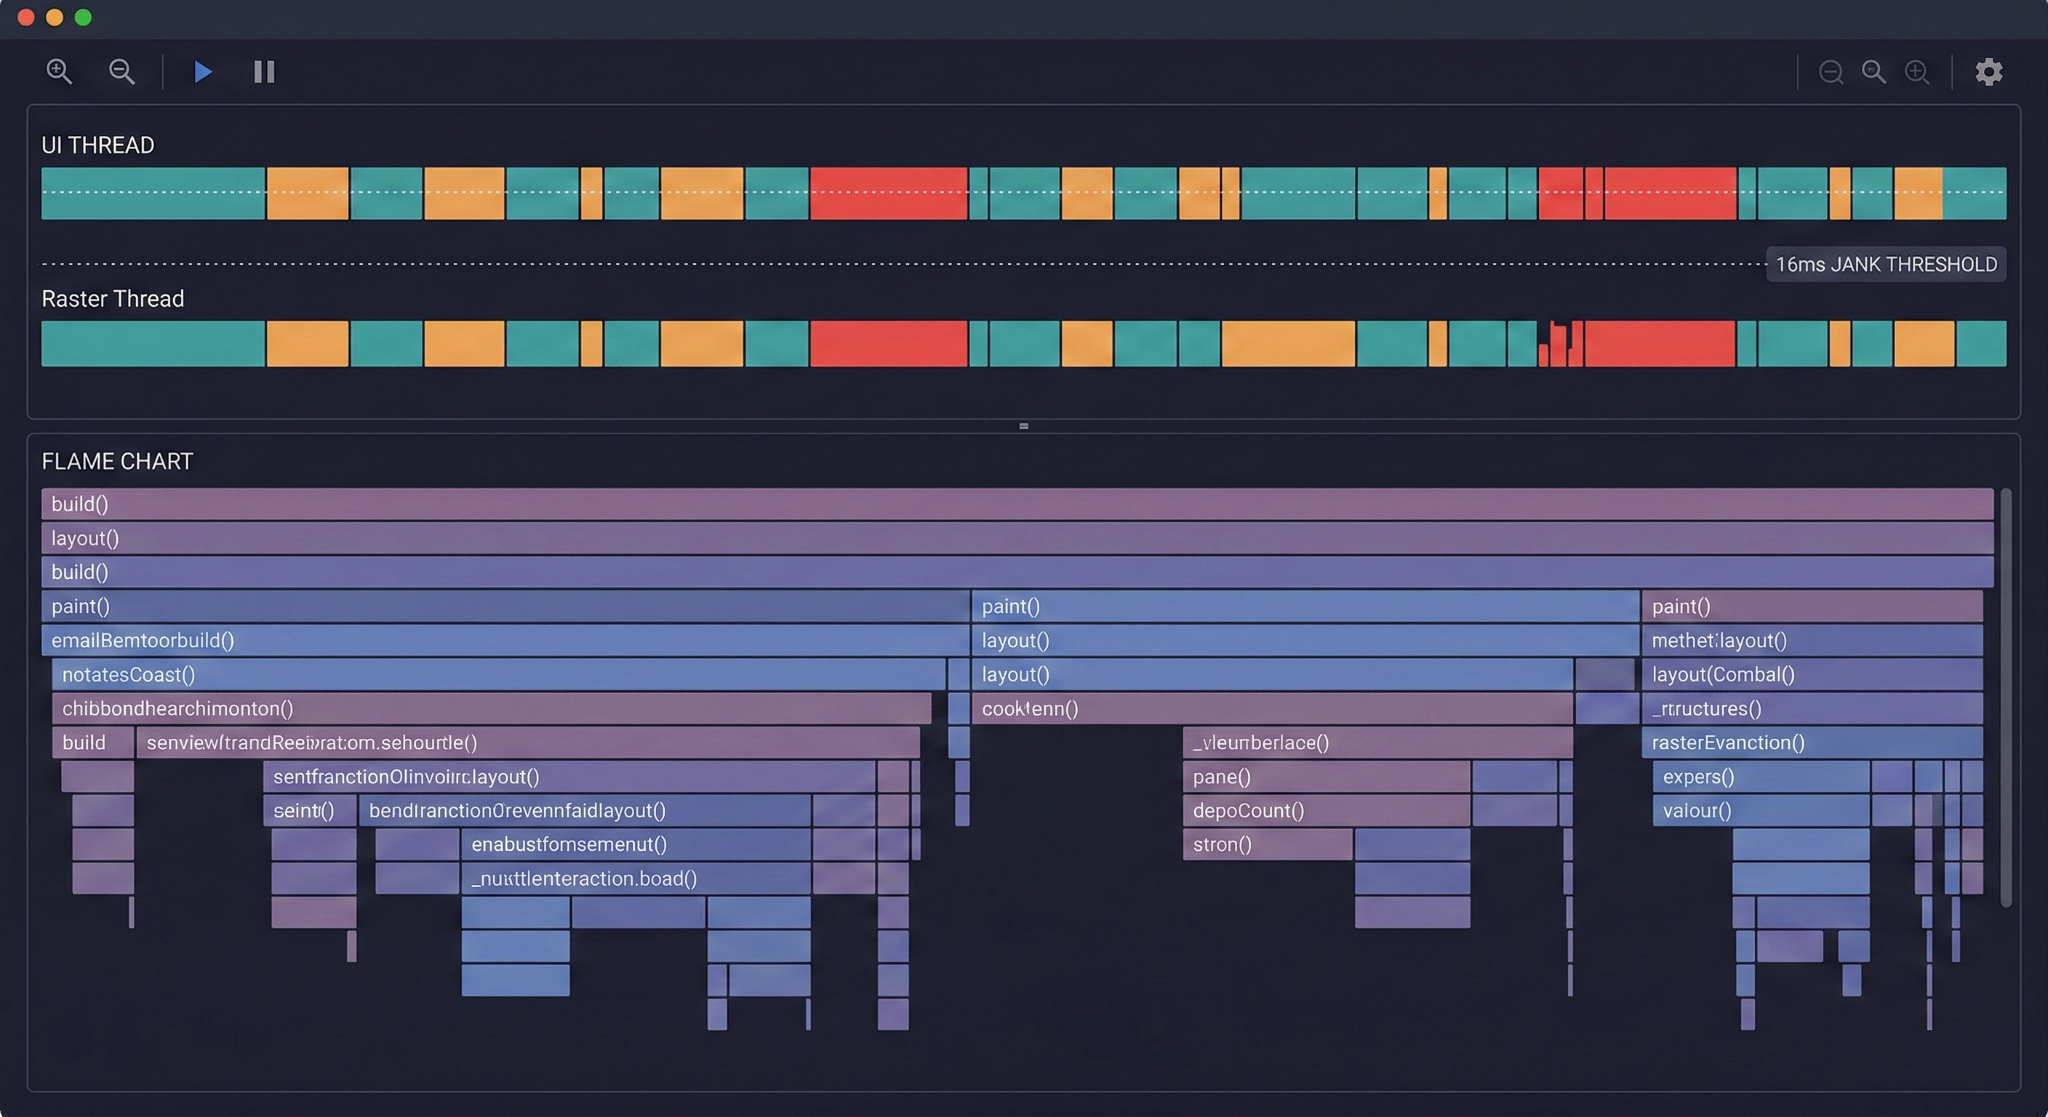
Each of these phases runs on one of two threads that DevTools exposes directly: the UI thread (which handles Dart code, including build, layout, and paint) and the raster thread (which composites layer trees on the GPU). The 60fps or 120fps frame budget is shared between these two threads. If either takes more than roughly 16ms (or 8ms on 120Hz devices), the frame misses its deadline and a jank event occurs. DevTools' Performance panel draws a timeline that maps directly onto this dual-thread model, making it immediately obvious which thread is the bottleneck.
Dart's runtime also exposes heap telemetry through a VM service protocol. DevTools connects to this service over WebSockets when you launch your app in debug or profile mode. This protocol is how the Memory panel streams live allocation data, how the CPU Profiler samples call stacks, and how widget inspector tracks rebuild counts. The entire DevTools surface is, architecturally, a rich frontend over this VM service protocol combined with Flutter engine tracing events.
Key concepts to hold in mind when profiling:
- Profile mode, not debug mode: Debug builds include assertions and the observatory overlay; they are significantly slower. Always profile in flutter run --profile.
- UI thread vs. raster thread: Jank is caused by one or both threads exceeding their frame budget.
- Widget rebuilds ≠ repaints: A widget can rebuild without triggering a repaint if its render object's layout and paint output doesn't change.
- Dart isolates: Heavy computation on the main isolate will block the UI thread. Offloading to compute() or a separate Isolate is measurable in DevTools.
- Shader warm-up: First-frame jank caused by shader compilation shows distinctly in the raster thread timeline.
Why It Matters in Modern Mobile Development
Profiling isn't a post-launch cleanup activity. In a continuous delivery environment where Flutter teams ship weekly or bi-weekly, performance regressions accumulate through incremental PRs, each of which seems harmless in isolation. A new animation here, a deeper widget tree there, an additional network call on a route transition—none of these individually tanks the frame rate, but together they create a product that feels sluggish three months after a clean launch.
DevTools addresses this by making performance data concrete and reproducible. Engineers can record a profiling session, share the export file, and reproduce the exact frame breakdown with a colleague or in a code review. This transforms performance from a subjective feeling ("the scroll seems slow") into an objective measurement ("frame 47 takes 34ms on the UI thread due to 1,200 widget rebuilds in the product list").
The tooling also matters from a user retention perspective. Mobile users are measurably more sensitive to frame drops than desktop users; a consistent 60fps experience is a baseline expectation, not a differentiator. Flutter's cross-platform architecture means performance regressions on one platform often don't surface on another during development, since GPU capabilities, screen refresh rates, and OS scheduling vary significantly. Profiling on-device in profile mode on both Android and iOS targets is the only reliable way to catch this class of bug before it reaches users.
Several dimensions of modern Flutter development make profiling especially important:
- Scroll performance in large lists: ListView.builder with expensive item widgets is a consistent jank source that only manifests with real data volumes.
- Animation jank from shader compilation: First-run jank on complex routes with CustomPainter or Lottie animations is a known Flutter pain point with specific tooling remedies.
- Memory growth in long-running sessions: Apps that stay open for hours accumulate unclosed streams, undisposed controllers, and growing image caches that only DevTools' memory timeline can surface.
- Startup latency from synchronous initialization: Code running before runApp() on the main isolate delays time-to-interactive in ways that profiling quantifies exactly.
- Isolate-to-isolate communication overhead: Apps using flutter_isolate or background processing can incur unexpected serialization costs visible in the CPU profiler.
Architecture & System Design Breakdown
DevTools is itself a Flutter web application. It communicates with your running app through the Dart VM Service Protocol, a JSON-RPC-based protocol served over a WebSocket from the Dart VM embedded in your app. When you run flutter run --profile, the VM service is automatically enabled and DevTools connects to it automatically from your IDE or via flutter pub global run devtools.
Your Flutter App (Device / Emulator)
        │
        │  VM Service Protocol (WebSocket)
        ▼
   Dart VM Service
        │
   ┌────┴─────────────────────────────────────────────────────┐
   │                  DevTools Frontend (Browser)             │
   │                                                          │
   │  ┌──────────────┐  ┌────────────┐  ┌──────────────────┐  │
   │  │  Performance  │  │   Memory   │  │   CPU Profiler  │  │
   │  │   Timeline   │  │  Profiler  │  │  (Sampled Stacks)│  │
   │  └──────────────┘  └────────────┘  └──────────────────┘  │
   │                                                          │
   │  ┌──────────────┐  ┌────────────┐  ┌──────────────────┐  │
   │  │   Inspector  │  │  Network   │  │    Logging       │  │
   │  │ (Widget Tree)│  │  Profiler  │  │    Console       │  │
   │  └──────────────┘  └────────────┘  └──────────────────┘  │
   └──────────────────────────────────────────────────────────┘
Each panel subscribes to different VM service streams. The Performance panel listens to the engine's timeline event stream, which includes discrete events for each rendering phase (build, layout, paint, composite). The Memory panel polls the VM heap snapshot API and subscribes to allocation notifications. The CPU Profiler uses the VM's sample-based profiling API, which captures a call stack snapshot at a configurable interval without requiring instrumentation in your code.
The Inspector panel is architecturally distinct: it communicates with a Flutter-specific extension layer registered by the framework at startup, which allows it to query and highlight the live widget tree, not just the Dart heap. This is why the Inspector can show which specific widget is responsible for an expensive rebuild—it has semantic access to the widget tree, not just raw memory addresses.
Implementation Deep Dive: Running a Profiling Session
Getting actionable profiling data from DevTools requires a deliberate setup. Running in the wrong build mode, on the wrong device, or without representative data will produce misleading results that drive incorrect optimization decisions.
Step 1: Launch in profile mode on a physical device.
Run flutter run --profile against a physical Android or iOS device, not a simulator. Simulators use your Mac's CPU and GPU, which have fundamentally different characteristics from a mobile SoC. Profile mode disables debug assertions and most observatory overhead but keeps the VM service and timeline events active.
Step 2: Open DevTools and navigate to the Performance tab.
DevTools opens automatically in your browser when using VS Code or IntelliJ with the Flutter plugin. Click "Performance" in the top navigation. Ensure "Enhance Tracing" is disabled initially—it adds overhead that skews frame timings.
Step 3: Enable relevant tracing options.
Under "Track Widget Builds," enable widget rebuild tracking. This instruments the build phase to annotate each frame with rebuild counts per widget type. It adds a small overhead but is essential for identifying rebuild-heavy screens.
Step 4: Reproduce the problematic interaction.
Scroll through the list, navigate to the slow route, or trigger the animation that feels sluggish. DevTools records all timeline events continuously. Reproduce the issue 3–5 times so you have multiple frame samples to compare.
Step 5: Stop recording and examine the frame chart.
The top section of the Performance tab shows a bar chart of frame durations. Frames exceeding the budget appear in red (for jank) or yellow (approaching the limit). Click any frame to see the detailed timeline breakdown below: which phase took how long, on which thread.
Step 6: Drill into the flame chart.
The bottom section shows a flame chart of the selected frame. The UI thread lane shows your Dart call stack during build, layout, and paint. Expand the widest bars to find the specific function—or widget—consuming the most time. Cross-reference with the widget rebuild table to confirm which widget types are rebuilding most frequently.
A minimal example of using RepaintBoundary to isolate an expensive custom painter once you've identified it in the flame chart:
// Before profiling: CustomPainter repaints on every parent rebuild
Column(
  children: [
    ExpensiveChartWidget(), // repaints whenever Column rebuilds
    SomeOtherWidget(),
  ],
)

// After profiling confirms unnecessary repaints:
Column(
  children: [
    RepaintBoundary(
      child: ExpensiveChartWidget(), // now has its own layer
    ),
    SomeOtherWidget(),
  ],
)
The Performance panel's "Raster" flame chart will show the layer composition cost dropping after this change—a measurable, verifiable improvement visible directly in the next profiling session.
Advanced Patterns & Optimization
Once you've internalized the basic profiling workflow, the highest-leverage optimizations come from understanding patterns that don't surface obviously in a single frame's flame chart but instead emerge across multiple recording sessions and memory timelines.
Shader compilation jank is one of the most misunderstood performance issues in Flutter. On first run, the GPU must compile GLSL shaders for each unique draw call. This compilation happens synchronously on the raster thread and can cause multi-hundred-millisecond freezes on the first animation run. DevTools shows this as extreme raster thread spikes that disappear on subsequent runs of the same animation. The fix is shader pre-warming: capturing a SkSL shader bundle using flutter run --cache-sksl and bundling it with your app. This is documented in the Flutter performance profiling guide.
Isolate offloading verification is another pattern where DevTools proves its value beyond simple frame analysis. If you've moved expensive JSON parsing or image processing to a background Isolate using compute(), the CPU Profiler can confirm that the main isolate is no longer blocked during that operation. You should see the main isolate's CPU usage drop to near zero during the computation, while a separate isolate thread appears with the heavy call stack.
The following advanced optimization directions yield the most consistent gains when guided by DevTools data:
- Const constructors at the widget level: The rebuild tracker will show that widgets declared with const register zero rebuilds in frames where their inputs haven't changed.
- Selector-scoped state access: Using context.select() from provider (or equivalent in Riverpod's ref.watch with select) constrains rebuilds to the exact widget that reads the selected value—visible as dramatically reduced rebuild counts in the Performance panel.
- ListView.builder with fixed item extents: Setting itemExtent allows Flutter to skip layout computation for off-screen items; the layout phase in the flame chart shrinks noticeably.
- Image caching policy: The Memory panel's allocation timeline will reveal if your app is decoding the same image multiple times. Image.asset with cacheWidth/cacheHeight constraints reduces decode memory.
- Avoid Opacity widget for animations: Opacity forces the subtree to paint into an offscreen buffer each frame. Use AnimatedOpacity or, better, FadeTransition with an Animation<double>, which achieves opacity through the compositing layer without triggering a repaint.
Real-World Production Scenarios
Scenario 1: E-commerce product feed with 60-item list.
A team reports that their product list scrolls smoothly in development but drops frames on mid-range Android devices in production. Profiling in DevTools reveals that each ProductCard widget rebuilds 60 times per scroll frame—because the parent ListView is wrapped in a Consumer that listens to an entire cart state object, causing every card to rebuild whenever any cart item changes. The fix is narrowing the Consumer scope to only the specific product ID's cart status using context.select(). After the change, the rebuild count per frame drops from 60 to 1–3, and the UI thread cost per frame falls from 18ms to 6ms.
Scenario 2: Complex onboarding animation with first-run jank.
A fintech app's onboarding sequence uses CustomPainter for a multi-step animated illustration. On first install, the animation freezes for 300–400ms at specific keyframes. The DevTools Performance panel shows raster thread spikes of exactly this duration at those frames, while the UI thread is idle. This is the shader compilation signature. The team captures an SkSL bundle using flutter run --cache-sksl --purge-persistent-cache, bundles it with the app via --bundle-sksl-path, and the first-run jank disappears entirely on subsequent installs. Subsequent profile sessions confirm raster thread cost at those keyframes drops from ~350ms to ~4ms.
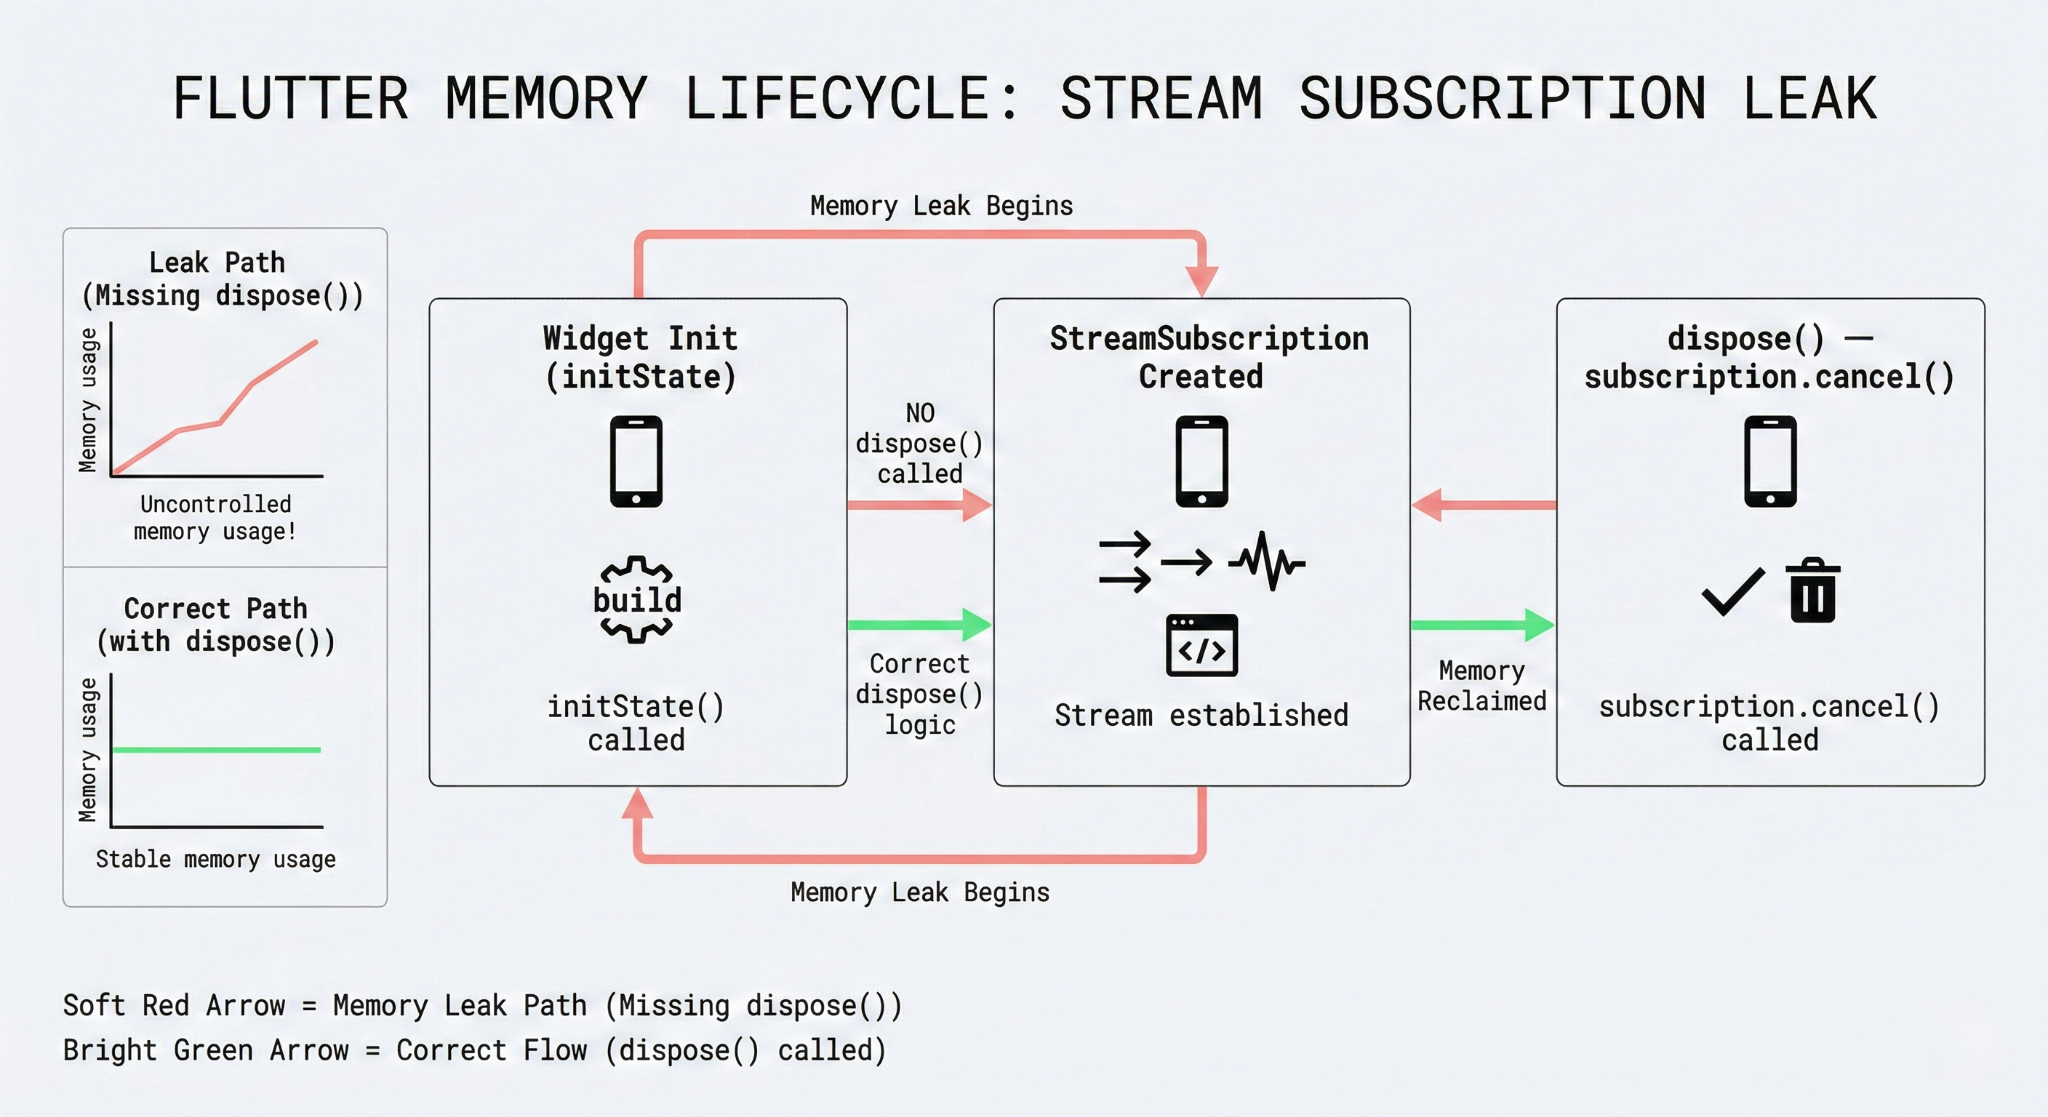
Scenario 3: Memory growth in a chat application.
A messaging app's memory footprint grows steadily over a 20-minute session, eventually triggering low-memory conditions on older devices. The DevTools Memory panel's "Live Allocation Tracking" feature reveals that StreamSubscription objects are accumulating—39 instances after 10 minutes where there should be at most 5. Cross-referencing with the widget inspector shows these subscriptions are created in a StatefulWidget's initState but never cancelled in dispose. The fix is a single subscription.cancel() call in dispose(), after which the Memory panel shows a flat allocation graph.
Scenario 4: Slow route transition due to synchronous asset loading.
A profile session on a settings screen transition reveals that the UI thread stalls for ~80ms during push(). The CPU Profiler flame chart shows this time consumed inside rootBundle.loadString() being called synchronously during build(). Moving this load into initState() with a FutureBuilder, or pre-loading the asset before the navigation, resolves the stall. The transition's UI thread cost in the next profiling session shows a clean 2ms build phase.
Common Pitfalls and Failure Patterns
The most consequential mistakes in Flutter profiling aren't technical—they're methodological. Engineers profile in the wrong build mode, on the wrong hardware, or interpret frame data without accounting for the tool's own overhead.
Profiling in debug mode is the most common error. Debug builds run Dart in JIT mode with enabled assertions and the widget rebuild counter overlay. JIT-compiled Dart is 2–5x slower than AOT-compiled profile or release mode. A screen that profiles at 8ms in profile mode might show 25ms in debug mode, leading to optimizations that solve a non-existent problem in production. Always use flutter run --profile.
Misattributing raster jank to Dart code is another pattern. When the raster thread is the bottleneck, the fix is almost never in your Dart widget code—it's in layer reduction, RepaintBoundary placement, shader pre-warming, or reducing overdraw. Optimizing widget build code when the raster thread is the bottleneck wastes engineering time. Read the thread lane labels carefully before diving into the flame chart.
The following mistakes consistently lead teams astray:
- Using the emulator as the profiling target: Emulators use CPU-based rendering, which eliminates GPU-specific issues like shader compilation jank and makes frame timings unreliable for production decisions.
- Ignoring the "Enhance Tracing" overhead: Enabling all enhanced tracing options simultaneously adds instrumentation overhead that inflates frame times, making code look slower than it is.
- Optimizing based on a single frame sample: Jank caused by garbage collection or scheduler preemption appears in isolated frames. Look at the 95th percentile frame time across a 10-second scroll recording, not individual spikes.
- Treating all widget rebuilds as bugs: Rebuilds are only a problem when they trigger expensive layout or paint. A lightweight widget that rebuilds 100 times in a frame may cost less than a single heavy widget that rebuilds once.
- Neglecting the memory profiler in performance investigations: Memory pressure causes increased GC frequency, which manifests as periodic UI thread pauses. Memory and performance problems are often linked; profiling both simultaneously often reveals the root cause faster.
Strategic Best Practices
Performance profiling pays the most dividends when it's integrated into the development workflow rather than treated as a firefighting tool. The following practices reflect how high-output Flutter teams operationalize DevTools across their release cycles.
Establish a profiling baseline early in the project. Before any feature work begins on a new screen, record a 10-second DevTools session on a mid-range physical device—something like a Pixel 6a or a mid-range Samsung—and save the export. This gives you a concrete before-state to compare against after feature development. The Flutter performance best practices documentation recommends this approach explicitly and provides target frame time thresholds to use as baselines.
When tracking down memory leaks specifically, always use "Live Allocation Tracking" rather than manual heap snapshots. Heap snapshots capture a moment in time and require manual diff comparison. Live tracking shows you exactly which allocation site is responsible for growing object counts in real time, which reduces investigation time significantly.
The following best practices form a coherent profiling discipline for production Flutter teams:
- Profile on the lowest-spec device in your target demographic: If you support Android devices with 2GB RAM, profile on one. Issues invisible on a high-end Pixel flagship are often severe on entry-level hardware.
- Save and version DevTools export files alongside PRs: A 10-second recording export attached to a performance-sensitive PR gives reviewers objective data to evaluate the impact of a change.
- Use Timeline.startSync / Timeline.finishSync for custom instrumentation: For complex business logic whose cost isn't obvious in the default timeline, manual tracing events appear directly in the flame chart, letting you measure specific code sections with microsecond precision.
- Run the CPU profiler during cold start: Cold-start latency is often caused by synchronous plugin initialization, heavy SharedPreferences reads, or large JSON decoding on the main isolate—all visible in the CPU Profiler if you start recording before runApp() resolves.
- Schedule quarterly performance review sessions: Set aside time to profile core user journeys on every major OS version and device tier you support. Flutter engine updates, plugin upgrades, and OS scheduler changes can all shift your performance characteristics without any changes in your own code.
- Cross-reference the Inspector's widget rebuild tree with the Performance flame chart: The Inspector shows which widgets rebuild; the Performance panel shows when and how expensively. Using both panels simultaneously is significantly more diagnostic than using either alone.
Conclusion
Flutter DevTools isn’t just for debugging—it’s a core observability tool that should be used continuously during development.
It provides deep insights (frame timing, rebuilds, memory, CPU, network), allowing most performance issues to be diagnosed without guesswork.
Effective usage requires discipline:
- Profile in profile mode, not debug
- Test on real devices
- Focus on worst-case (95th percentile) performance
- Analyze UI and raster threads separately
In mature teams, DevTools becomes part of the workflow—profiling data is shared and reviewed like code, making performance a team-wide responsibility.
In short, DevTools turns performance from reactive fixes into a continuous, measurable process—helping apps stay fast over time.