.svg)


Flutter's rendering pipeline is one of the most sophisticated in the cross-platform mobile landscape. It bypasses native UI components entirely, drawing every pixel through its own graphics engine — Skia (and increasingly Impeller on iOS and newer Android devices). This architecture is what makes Flutter capable of achieving genuinely smooth 60fps or 120fps rendering across platforms. But it also means that performance bottlenecks have nowhere to hide. When something goes wrong in your Dart code, your widget tree, or your render pipeline, frames drop. And on a 60Hz display, you have exactly 16.67 milliseconds to build, layout, paint, and composite every single frame.
Most Flutter performance problems don't stem from the framework itself. They come from how developers structure their widget trees, schedule work across isolates, interact with platform channels, or animate complex UI. The Dart VM's ahead-of-time compilation model in release builds is remarkably efficient, but it cannot compensate for architectural decisions that were made at the wrong level of abstraction. Understanding why frames drop requires understanding what Flutter actually does inside each frame budget — not just at a surface level, but at the level of threads, rasterization, and the compositor.
This article is written for mid-to-senior Flutter engineers who are past the tutorial stage and are dealing with real production applications: apps with complex navigation stacks, heavy list rendering, custom painters, image-heavy feeds, and non-trivial state management. The goal is to give you both the conceptual model and the actionable techniques to diagnose and eliminate frame drops systematically.
Foundational Concept: The Flutter Rendering Pipeline
Flutter runs three primary threads during rendering: the UI thread (where Dart code executes), the raster thread (where GPU draw calls are submitted), and the platform thread (where native OS code runs). These threads communicate through a message-passing mechanism, and the frame pipeline flows through all of them in sequence. A dropped frame can originate in any of them.
Each frame begins on the UI thread. Flutter's scheduler triggers a drawFrame() call, which executes the build phase (constructing a new element and widget tree if dirty), the layout phase (computing sizes and positions using a constraint-based system), and the paint phase (generating a layer tree of paint commands). This layer tree is then handed off to the raster thread, which uses Skia or Impeller to convert it into actual GPU instructions and submit them to the compositor. If either thread takes longer than the frame budget, a frame is dropped.
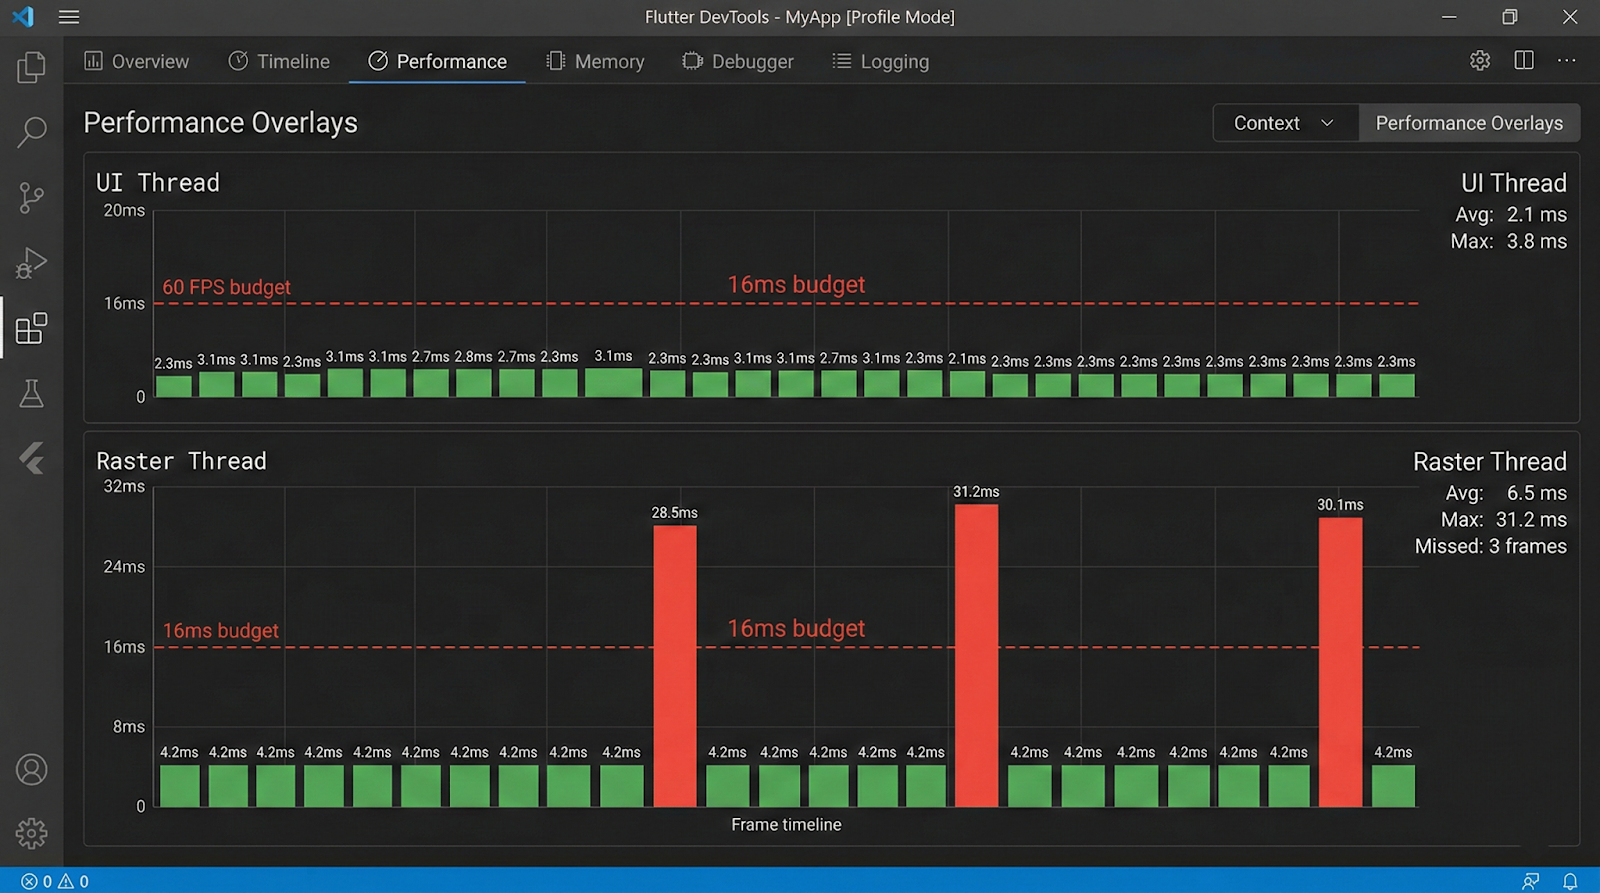
The critical insight here is that jank can be caused independently by either thread. DevTools' performance overlay shows two separate graphs — one for the UI thread and one for the raster thread — and misdiagnosis is common when engineers look at only one. A spike in the raster thread while the UI thread remains flat indicates GPU-side overhead (complex blends, clipping, image decoding), while the reverse indicates Dart-side CPU pressure.
Flutter's rendering model also introduces the concept of the layer tree. During the paint phase, widgets that use RepaintBoundary generate isolated layers. These layers can be cached between frames and composited without re-executing their paint logic. This is both a powerful optimization primitive and a source of confusion when developers apply it incorrectly or redundantly.
Key architectural facts about the pipeline:
- The UI thread runs all Dart code, including build(), initState(), listeners, and animations.
- The raster thread performs GPU rasterization and cannot be directly influenced by Dart code.
- Image decoding happens on a separate I/O thread by default in Flutter.
- Isolates run on separate threads but cannot directly update the widget tree.
- SchedulerBinding.scheduleFrame() initiates the frame pipeline; dirty RenderObjects trigger layout and paint on the next frame.
Why It Matters in Modern Mobile Development
Mobile users have an almost tactile sensitivity to frame drops. Research in human-computer interaction consistently shows that users perceive interactions as sluggish when frame rates dip below 60fps, even if they cannot consciously identify the cause. In practice, this translates to user churn: an app that stutters during scroll or transition feels broken, regardless of how feature-rich it is. For Flutter specifically, the promise of native-like performance is part of the value proposition, and delivering on that promise requires active performance engineering, not passive reliance on the framework.
Beyond user perception, frame drops have downstream consequences for production teams. Performance regressions introduced during rapid feature development are notoriously difficult to attribute after the fact. A build and layout overhead that's imperceptible on a flagship device running at 120Hz can cause severe jank on a mid-range Android device running at 60Hz with a slower GPU. This disparity means that performance issues often surface only in QA on physical devices or, worse, in production crash and ANR reports.
The modern Flutter release cycle also means that performance-related APIs evolve. The migration from Skia to Impeller on iOS (and in progress on Android) changes which operations are GPU-accelerated, which shaders are pre-compiled, and what the raster thread cost model looks like. Engineers who built their mental model around Skia behavior need to revisit assumptions, particularly around custom painters, backdrop filters, and blur effects.
Why performance discipline matters in Flutter specifically:
- Dart's garbage collector pauses execution on the UI thread, causing GC-induced jank during object-heavy workloads.
- Widget rebuilds are inexpensive individually but costly in aggregate when triggered unnecessarily across large subtrees.
- The raster thread has no access to Dart APIs, making GPU-side problems harder to instrument without platform tooling.
- Flutter apps running in profile mode behave meaningfully differently from debug mode — always profile in release or profile builds.
- Low-end Android devices (which represent a significant global market share) have substantially slower GPUs and less RAM, amplifying every inefficiency.
Architecture & System Design Breakdown
To fix frame drops, you need a mental model of how Flutter's threads and pipeline stages compose into a complete frame.
The following diagram represents the sequential stages within a single frame budget:
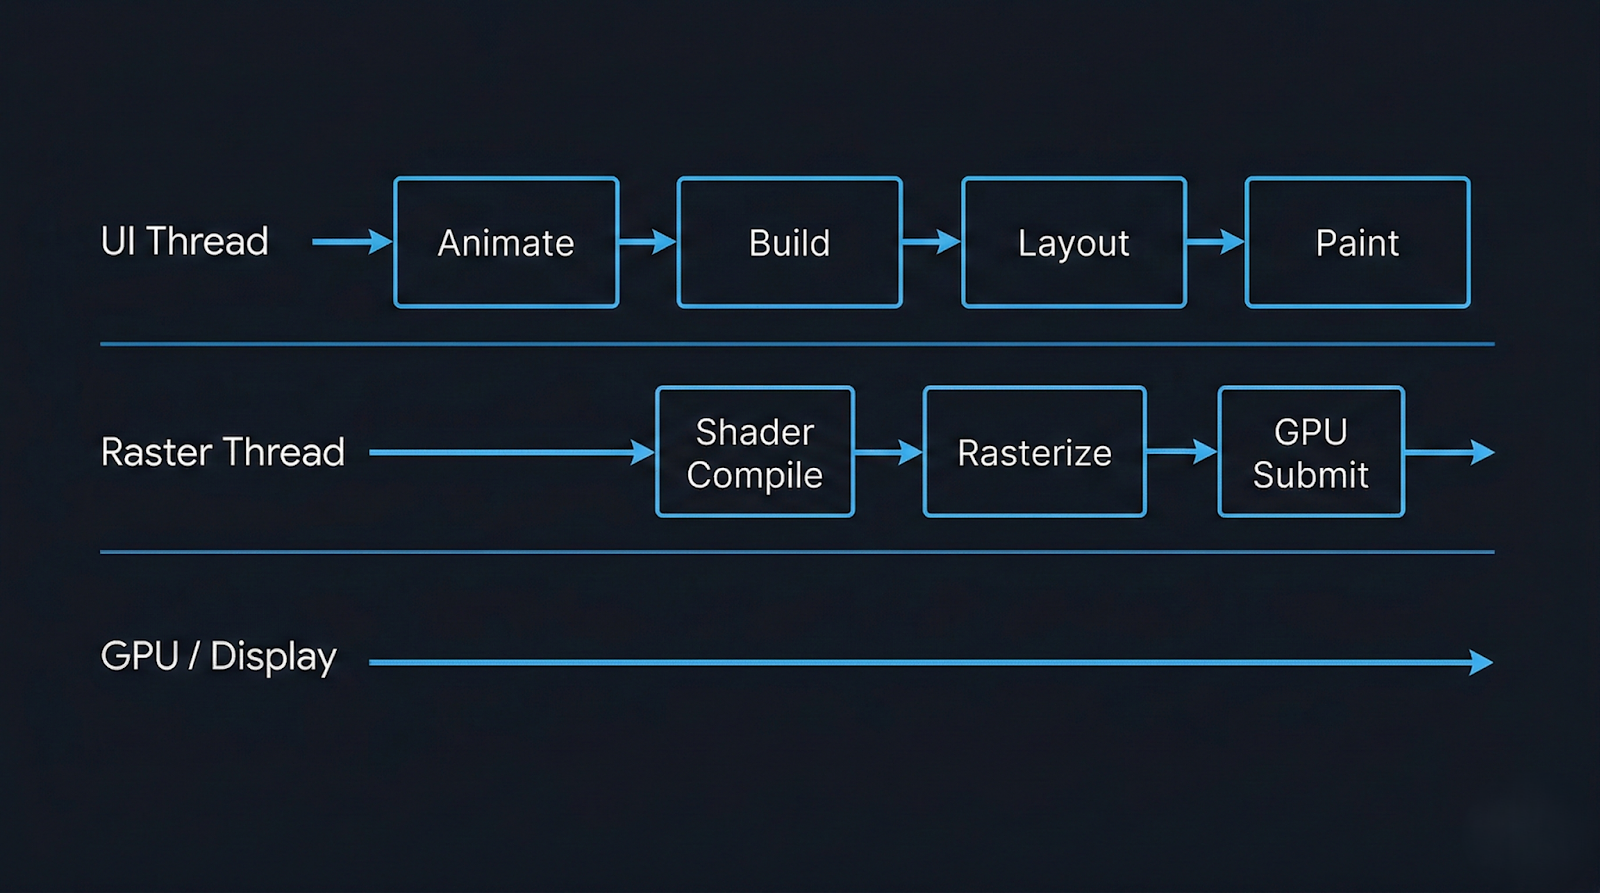
Each stage has its own failure modes. Build phase jank is caused by expensive build() methods, deeply nested widget trees that are marked dirty unnecessarily, or synchronous I/O on the UI thread. Layout phase jank is rarer but appears with intrinsic size measurements (IntrinsicWidth, IntrinsicHeight) that force multiple layout passes. Paint phase jank comes from complex custom painters, excessive opacity compositing, or unnecessary saveLayer() calls.
The raster thread is where GPU cost lives. Backdrop filters, large blur radii, multiple overlapping ClipRRect layers, and un-cached gradients all add GPU workload. Shader compilation jank — the stutter that occurs when a new shader variant is encountered for the first time — was a major issue under Skia and has been substantially addressed by Impeller's ahead-of-time shader compilation model. However, it is still relevant in Skia-backed configurations and on certain Android GPU drivers.
The compositing step assembles the layer tree. Each RepaintBoundary widget creates an isolated layer that can be composited independently. This means small updates within a repaint boundary don't require re-painting sibling layers. However, each layer has a memory cost, and excessive use of repaint boundaries can increase GPU memory pressure and complicate compositing.
Implementation Deep Dive
Diagnosing and fixing frame drops in a Flutter app follows a disciplined workflow. Guessing without profiling data is one of the most common mistakes senior engineers make when under release deadline pressure, and it typically results in premature optimizations that address the wrong bottleneck.
Step 1: Profile in profile mode on a physical device.
Use flutter run --profile and connect the Flutter DevTools performance tab. Never profile in debug mode — the debug VM includes assertions, observatory overhead, and disables AOT compilation, all of which distort performance characteristics dramatically.
Step 2: Enable the performance overlay.
In DevTools or via WidgetsApp(showPerformanceOverlay: true), observe which thread is spiking. A consistent raster thread spike with a calm UI thread points to GPU-side problems. The inverse indicates Dart-side CPU pressure.
Step 3: Use the Timeline view to identify expensive frames.
The DevTools timeline shows individual frame events broken down by phase. Look for frames where the build phase exceeds 4ms, the layout phase exceeds 2ms, or paint exceeds 3ms. Any of these individually can consume your budget before the raster thread has even started.
Step 4: Identify unnecessary rebuilds.
Add debugPrintRebuildDirtyWidgets = true; temporarily to your main function to log widget rebuilds to the console. In a well-optimized app, state changes should trigger the minimum necessary widget subtree rebuild. If you see top-level widgets rebuilding on every interaction, your state architecture is leaking scope.
Step 5: Instrument with custom timings.
For specific operations you suspect are slow, use Timeline.startSync() and Timeline.finishSync() from dart:developer to create custom timeline events that appear in DevTools. This is essential for async data pipelines that span multiple frames.
Step 6: Validate fixes against baseline metrics.
After each optimization, re-run the profiler and compare frame timing distributions. Don't rely on subjective feel. Use the frame timing data from SchedulerBinding.addTimingsCallback() to log P99 frame durations in production-like conditions.
A meaningful code-level intervention worth highlighting is the targeted use of RepaintBoundary around widgets that update frequently but are visually isolated. Consider a chat message list where typing indicators update every few hundred milliseconds. Wrapping the indicator widget in RepaintBoundary ensures that its repaint cycle does not invalidate the layer containing the
message list above it:
RepaintBoundary(
  child: TypingIndicator(isTyping: isTyping),
)
This is simple, but the impact — preventing full-list repaint on every typing event — can be significant in a complex layout.
Advanced Patterns & Optimization
Beyond the standard profiling workflow, there are several patterns that consistently yield meaningful frame budget savings in production Flutter applications. These aren't micro-optimizations; they are architectural decisions that scale.
The most impactful is aggressive state locality. Rebuilds cascade downward from the point where setState() or a provider notification fires. If that notification fires at the root of your widget tree — a common pattern in naively implemented global state — then every widget descending from that root must be evaluated for rebuild eligibility. Even though Flutter's diffing algorithm is efficient, evaluating tens of thousands of elements per frame is not free. Moving state as close to its consumer as possible using scoped InheritedWidget, ValueNotifier, or select()-gated Consumer widgets in Provider/Riverpod dramatically reduces the rebuild surface.
The second pattern is lazy rendering. ListView.builder and SliverList with a delegate are well-known, but engineers still reach for Column inside a SingleChildScrollView with a manually built list of children. In a list of 200 items, this creates 200 RenderObjects immediately, all of which participate in layout and paint even when off-screen. The builder pattern defers this work to scroll position, creating only the elements visible in the viewport plus a configurable cache extent.
Custom painters deserve special attention. The CustomPainter API gives you direct access to the Canvas API, which is powerful but expensive when misused. The shouldRepaint() method is the key optimization lever — it should return false whenever the inputs to the painting logic have not changed. Returning const CustomPainter() from a stateless build method ensures the painter instance is stable, and a correctly implemented shouldRepaint() ensures the canvas is not re-rasterized unnecessarily.
Advanced optimization levers worth knowing:
- Use const constructors everywhere possible to prevent widget instantiation overhead and enable the framework's element reuse mechanism.
- Avoid Opacity widget for values other than 0 and 1 — it forces a saveLayer() call on the raster thread; prefer Color.withOpacity() on specific Paint objects when animating.
- Pre-cache images with precacheImage() in route transitions to avoid decode-on-display jank in image-heavy screens.
- Use AutomaticKeepAliveClientMixin in tab views only for widgets with expensive state — avoid blanket usage as it prevents GC of off-screen tabs.
- Offload heavy computation (JSON parsing, cryptographic operations, data transformations) to isolates using compute() or Isolate.spawn() to keep the UI thread clear.
Real-World Production Scenarios
Scenario 1: Infinite scroll feed with mixed media
A social feed combining text cards, image posts, and video thumbnails is one of the most demanding Flutter use cases. The most common failure pattern is building the entire cell widget unconditionally — including network images and video players — regardless of whether the cell is on screen. The fix involves three layers: ListView.builder for lazy construction, AutomaticKeepAlive used surgically only for video players that maintain playback state, and CachedNetworkImage with a well-tuned memory cache size. Additionally, large images should be decoded at display resolution rather than their native resolution; using ResizeImage or passing cacheWidth/cacheHeight to Image.network() reduces both decode time and GPU memory consumption.
Scenario 2: Complex animated transitions
Page transitions that involve multiple simultaneous animations — a hero transition, a parallax background, a staggered list entrance — frequently cause UI thread spikes during the transition build phase. The root cause is usually that the incoming page's widget tree is built synchronously during the animation frame where the transition begins. Deferring non-critical widget construction with TickerFuture delays or using InteractiveViewer or staged animation controllers with staggered begins can spread the build cost across multiple frames, keeping individual frame budgets manageable.
Scenario 3: Real-time data updates
Applications that receive high-frequency data updates via WebSocket (trading apps, live sports scores, monitoring dashboards) often make the mistake of calling setState() on every incoming event. At 10 events per second, this triggers 10 build cycles per second on the UI thread. The correct pattern is to debounce or throttle updates, batch them into a single state update using a periodic timer, and use StreamBuilder with a carefully managed stream that emits only when the UI actually needs to reflect a change.
Scenario 4: Shader jank on first render
On Skia-backed Flutter (most Android devices as of mid-2024), the first time a visual effect involving a new shader variant is rendered, the GPU driver must compile the shader on the fly. This is a blocking operation on the raster thread and can cause a multi-frame stall. The official mitigation is shader warm-up using flutter run --cache-sksl to capture shader usage in a SkSL file, then bundling that file with the app to pre-populate the shader cache at startup. On Impeller-backed configurations (iOS, and Android with Impeller opt-in), this problem is largely eliminated because shaders are compiled at build time, though the trade-off is slightly increased app binary size.
Common Pitfalls and Failure Patterns
The most persistent frame-drop patterns in production Flutter code tend to share a common characteristic: they are invisible in debug mode and on high-end devices. They reveal themselves only under load, on constrained hardware, or during the specific user interactions that trigger the problematic code path.
One of the most frequently encountered mistakes is performing synchronous file I/O or synchronous preference reads on the UI thread during widget build. SharedPreferences.getInstance() is async, but engineers occasionally cache the instance and then call synchronous getters during build() — getters that internally block on platform channel round-trips in some implementations. Any synchronous platform channel call on the UI thread will block it for the duration of the native-side round-trip, which can easily exceed a full frame budget.
A second persistent issue is the misuse of GlobalKey. While GlobalKey provides a stable identity for an element across tree positions, it is significantly more expensive than local keys because it maintains a global registry lookup on every build. Using GlobalKey for form fields or scaffold access is conventional, but applying it liberally to list items or frequently rebuilt widgets is a source of measurable build-phase overhead.
Common pitfalls to watch for in production code:
- Calling expensive operations in build() — including DateTime.now(), Random(), or synchronous parsing — that should be memoized or computed in initState().
- Using AnimatedBuilder around an animation but rebuilding a subtree far larger than necessary; the builder's child parameter exists precisely to memoize the non-animated subtree.
- Forgetting to dispose of AnimationController and StreamSubscription objects, leading to memory leaks that grow over time and increase GC pressure.
- Wrapping large widget subtrees in Opacity with a fixed non-zero, non-one value, forcing persistent saveLayer() calls on every frame even when nothing is changing.
- Using MediaQuery.of(context) deep in a widget tree, which subscribes that widget to all MediaQuery changes (including keyboard appearance), triggering unnecessary rebuilds during soft keyboard transitions.
Strategic Best Practices
Performance engineering in Flutter is most effective when it's built into the development process rather than addressed reactively. The cost of retrofitting performance into a mature, complex codebase is significantly higher than establishing the right patterns from the beginning. This is not a call for premature optimization, but for baseline discipline: knowing which patterns are expensive and avoiding them by default.
Start with a meaningful performance budget. Define what "acceptable" means for your specific app. A target of P95 frame time under 12ms on a mid-range device (e.g., a two-year-old Android device with 4GB RAM) is a concrete, testable constraint. Without a budget, engineers cannot make principled trade-offs between feature complexity and rendering cost. The Flutter DevTools performance documentation provides guidance on interpreting frame timing data and setting realistic targets.
Integrate performance regression testing into CI. Using flutter drive with performance tests that measure frame durations against a fixed device baseline will catch regressions before they reach production. The integration testing guide in Flutter's documentation covers how to capture and assert on frame timing metrics. A regression gate that fails builds when P99 frame time exceeds a threshold is simple to implement and high-value.
Treat the DevTools profiler as a first-class development tool, not an emergency diagnostic. Running a profiling session on every significant feature before merging it normalizes performance awareness across the team. It also makes it significantly easier to attribute regressions — if profiling is done regularly, you have a clear before/after comparison.
Strategic best practices for production Flutter apps:
- Adopt scoped state management (Riverpod, Bloc, or equivalent) from day one to enforce state locality and prevent global rebuild cascades.
- Instrument production apps with frame timing callbacks using SchedulerBinding.addTimingsCallback() and report P99 frame durations to your observability platform.
- Use const widgets aggressively; the Dart analyzer's prefer_const_constructors lint rule can automate enforcement.
- Audit your widget tree with the DevTools Widget Inspector's repaint rainbow feature before each major release to identify unexpectedly repainting regions.
- For apps targeting both 60Hz and 120Hz displays, test scrolling and animation performance specifically at 120Hz on compatible devices — the tighter frame budget (8.33ms) exposes bottlenecks that 60Hz masks.
- Review all CustomPainter implementations for correct shouldRepaint() logic as part of code review; it is the single most commonly incorrect method in custom paint code.
Conclusion
Frame drops in Flutter are almost always diagnosable and fixable with the right instrumentation and conceptual model. The framework gives you detailed, thread-level visibility into rendering performance through DevTools, and its architecture — separate UI and raster threads, a compositing layer system, and a constraint-based layout engine — provides clear optimization primitives when you know how to use them. The engineers who struggle most with Flutter performance are typically those who treat the framework as a black box and reach for optimization heuristics without profiling data. The engineers who ship consistently smooth apps treat the 16ms frame budget as a real constraint that every feature must respect.
The shift from Skia to Impeller represents a meaningful change in the raster thread cost model, particularly around shader compilation and blur-heavy effects. As Impeller matures and reaches stable status on Android, some historically expensive operations will become cheaper, but new cost profiles will emerge. Staying current with the Flutter rendering roadmap and re-validating performance assumptions across major SDK upgrades is a necessary part of production Flutter engineering.
Performance is not a feature that can be deferred. The patterns that cause frame drops — large dirty rebuild trees, synchronous work on the UI thread, unthrottled state updates, expensive GPU operations — do not become cheaper as an app grows. They compound. A codebase that drops frames at medium scale will drop more frames at full scale, and the cost of addressing it increases proportionally. The most effective Flutter teams treat performance profiling as a continuous discipline, not a one-time audit. That discipline, applied early and consistently, is what separates Flutter apps that merely work from Flutter apps that genuinely feel native.