.svg)


Introduction
Few things are more frustrating for an Android developer than a crash report that reads:
java.lang.OutOfMemoryError: Failed to allocate an X-byte allocation with Y free bytes.
OutOfMemoryError (OOM) is one of the most common yet misunderstood runtime errors in Android development. It does not always mean your device is out of RAM; it means the Android Runtime (ART) could not allocate a contiguous block of memory, usually due to memory leaks, oversized bitmaps, or inefficient resource management.
This guide walks you through exactly why OOM errors happen, how to diagnose them using Android Studio's built-in tools, and proven solutions with working code examples.
Problem Statement
What Is an OutOfMemoryError?
Android apps run inside a sandboxed process with a fixed heap limit, typically 32 MB to 512 MB, depending on the device and largeHeap configuration. When your app tries to allocate more memory than this limit allows, the system throws an OutOfMemoryError.
 java.lang.OutOfMemoryError: Failed to allocate an 8388616-byte allocation
 with 3145728 free bytes and 6MB until OOM, target footprint 268435456,
 growth limit 268435456
Android App Memory Architecture
The diagram below shows how Android partitions your app's memory. The Java Heap is where most OOM errors originate. Bitmap objects and Activity instances live here.
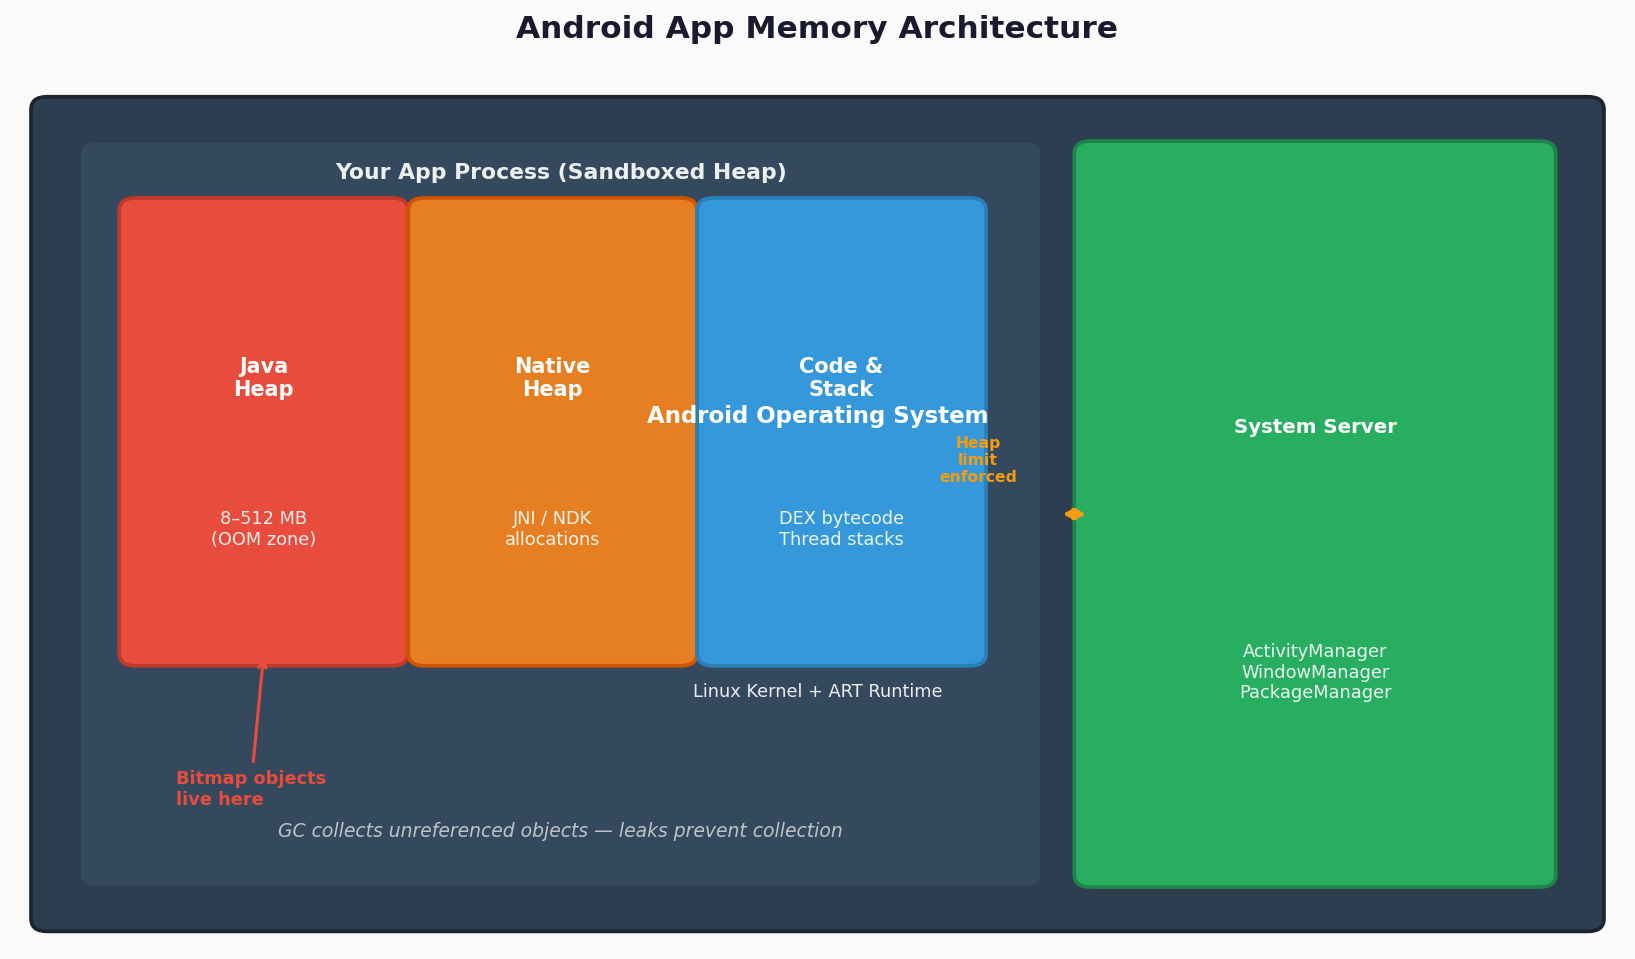
Figure 1: Android App Memory Architecture - Java Heap, Native Heap, and System Server
Common Root Causes
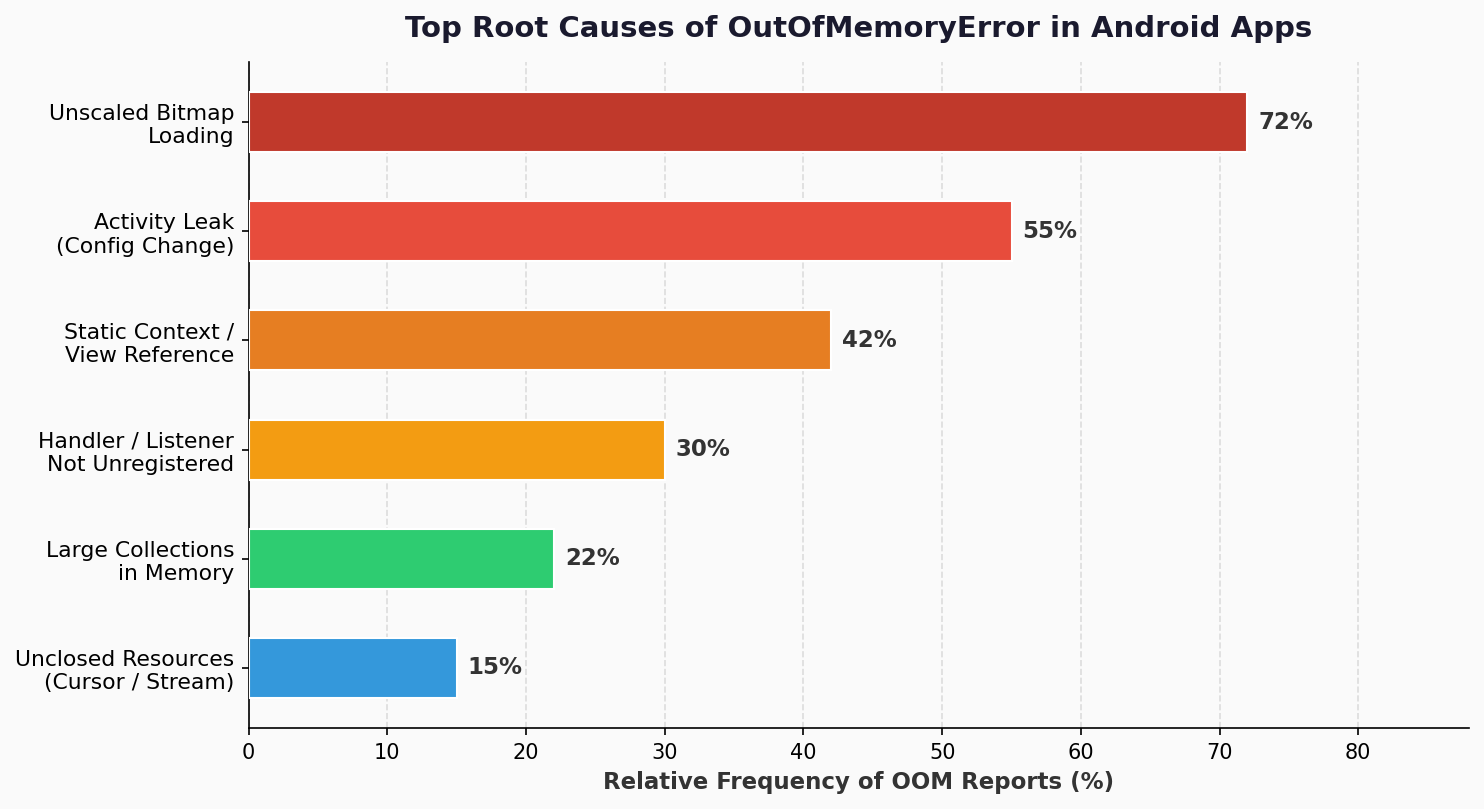
Figure 2: Relative frequency of OutOfMemoryError root causes in Android production apps
IMPORTANT: Android does not run a full GC cycle before throwing an OutOfMemoryError. A leaked Activity can silently accumulate until heap exhaustion.
Solution & Implementation
Step 1: Diagnose with Android Studio Memory Profiler
Before fixing anything, measure it. Android Studio (Hedgehog 2023.1.1+) includes a built-in Memory Profiler. Open it via View → Tool Windows → Profiler, select Memory, reproduce the crash scenario, then capture a heap dump.
What to look for in the heap dump:
- Objects with unexpectedly high instance counts (e.g., 50 Activity instances)
- Bitmap objects consume disproportionate memory
- byte[] allocations that are never released
HOW TO: Screenshot Tip: Open Android Studio → Run app → Profiler → Memory → Click "Record" button → Reproduce the crash → Stop → Export heap dump (.hprof).
Step 2: Fix Bitmap Loading (Most Common OOM Cause)
Loading a 12 MP camera image (4000×3000 px) directly consumes ~46 MB for a single image. The chart below shows the dramatic difference between loading strategies.
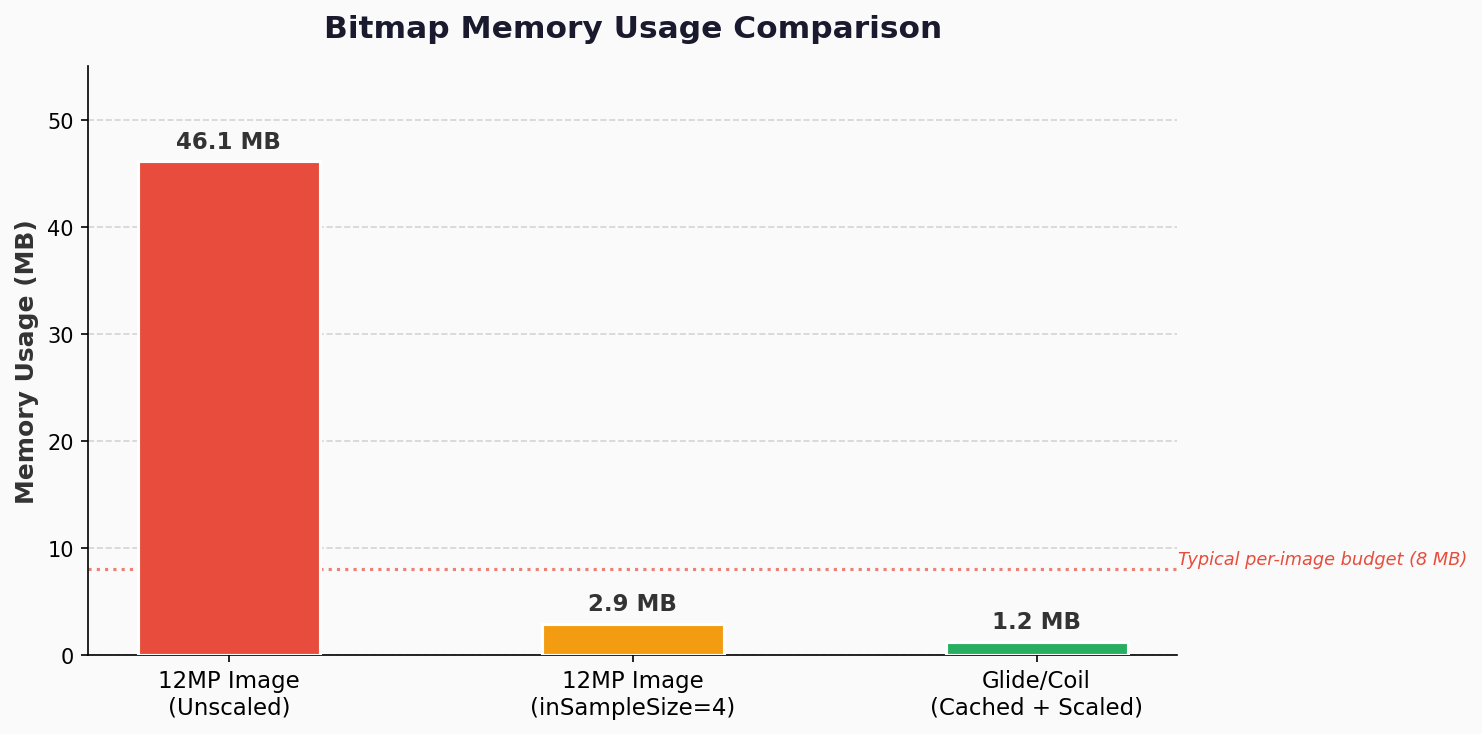
Figure 3: Memory usage comparison Unscaled bitmap vs inSampleSize scaling vs Glide/Coil
Bad Practice: Never do this:
 // DO NOT do this — loads a full-resolution image into memory
 val bitmap = BitmapFactory.decodeFile(imagePath)
 imageView.setImageBitmap(bitmap)
Correct Approach Scale Before Loading:
 fun decodeSampledBitmap(filePath: String, reqWidth: Int, reqHeight: Int): Bitmap {
  // First pass: read dimensions only (no pixel data loaded)
  val options = BitmapFactory.Options().apply { inJustDecodeBounds = true }
  BitmapFactory.decodeFile(filePath, options)
  // Calculate safe sample size
  options.inSampleSize = calculateInSampleSize(options, reqWidth, reqHeight)
  // Second pass: decode at reduced size
  options.inJustDecodeBounds = false
   return BitmapFactory.decodeFile(filePath, options)
 }
 fun calculateInSampleSize(options: BitmapFactory.Options, reqW: Int, reqH: Int): Int {
  val (height, width) = options.run { outHeight to outWidth }
  var inSampleSize = 1
  if (height > reqH || width > reqW) {
      val halfH = height / 2; val halfW = width / 2
      while ((halfH / inSampleSize) >= reqH && (halfW / inSampleSize) >= reqW)
          inSampleSize *= 2
  }
  return inSampleSize
}
Recommended Glide v4.16.0 (handles lifecycle + caching automatically):
 // build.gradle: implementation("com.github.bumptech.glide:glide:4.16.0")


 Glide.with(context)
  .load(imageUrl)
  .diskCacheStrategy(DiskCacheStrategy.ALL)
  .placeholder(R.drawable.placeholder)
  .error(R.drawable.error_image)
  .into(imageView)
Recommended Coil v2.6.0 (Kotlin-first, coroutine-based):
// build.gradle: implementation("io.coil-kt:coil:2.6.0")


 imageView.load(imageUrl) {
   crossfade(true)
   placeholder(R.drawable.placeholder)
   error(R.drawable.error_image)
   size(ViewSizeResolver(imageView))
 }
NOTE: Glide and Coil automatically cancel pending requests when the Activity/Fragment is destroyed, eliminating an entire category of bitmap memory leaks.
Step 3: Understand and Fix Memory Leaks
The flow diagram below contrasts how an Activity leak accumulates vs. how ViewModel correctly avoids retaining the Activity reference.
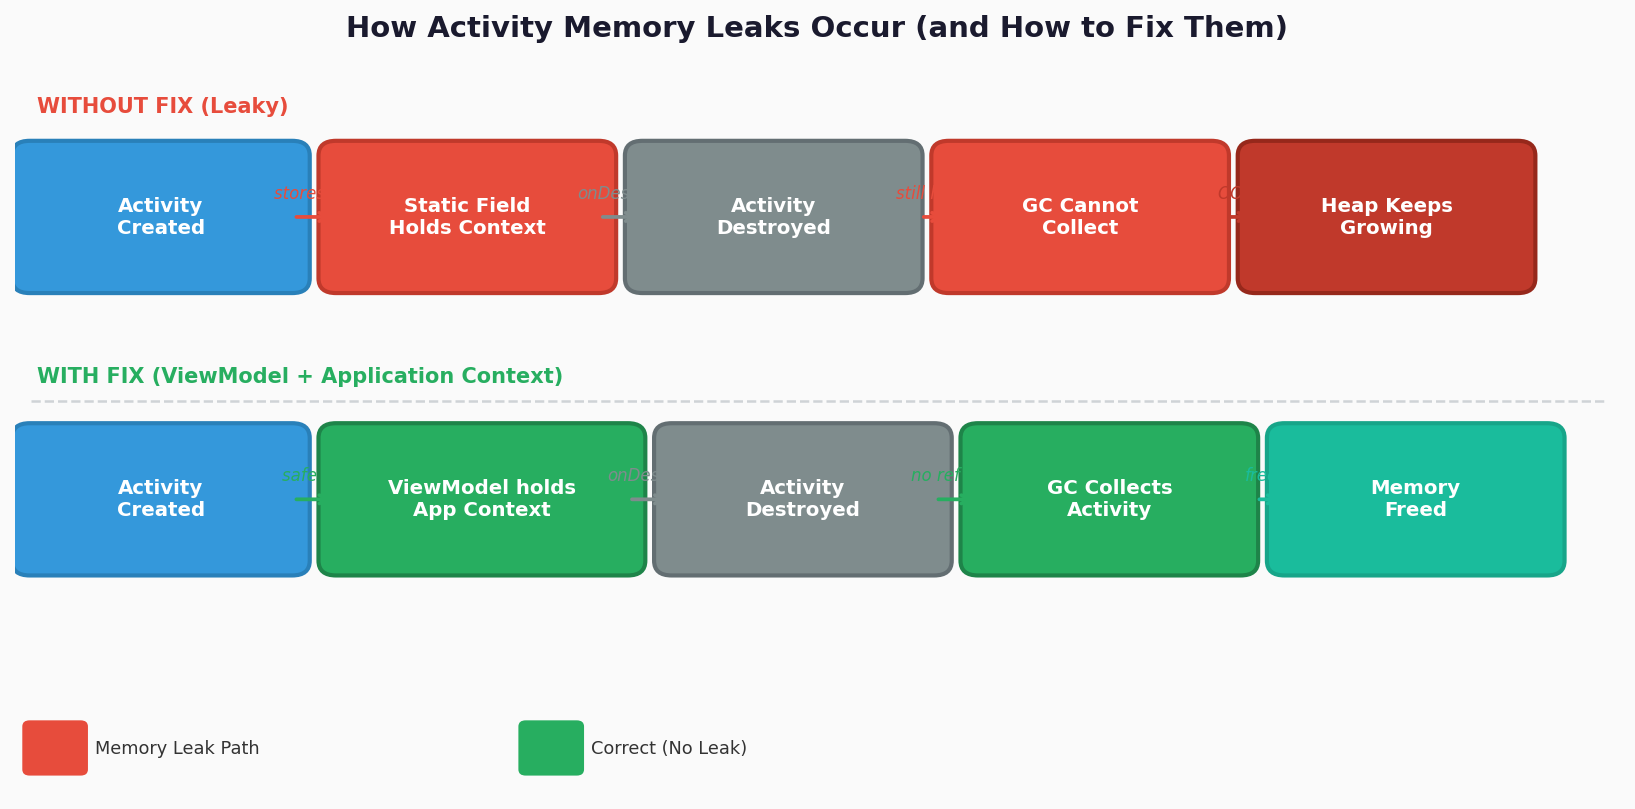
Figure 4: Activity memory leak flow vs. correct ViewModel-based fix
The chart below shows how heap usage grows over screen rotations when a static reference leaks the Activity versus the flat line achieved with ViewModel.
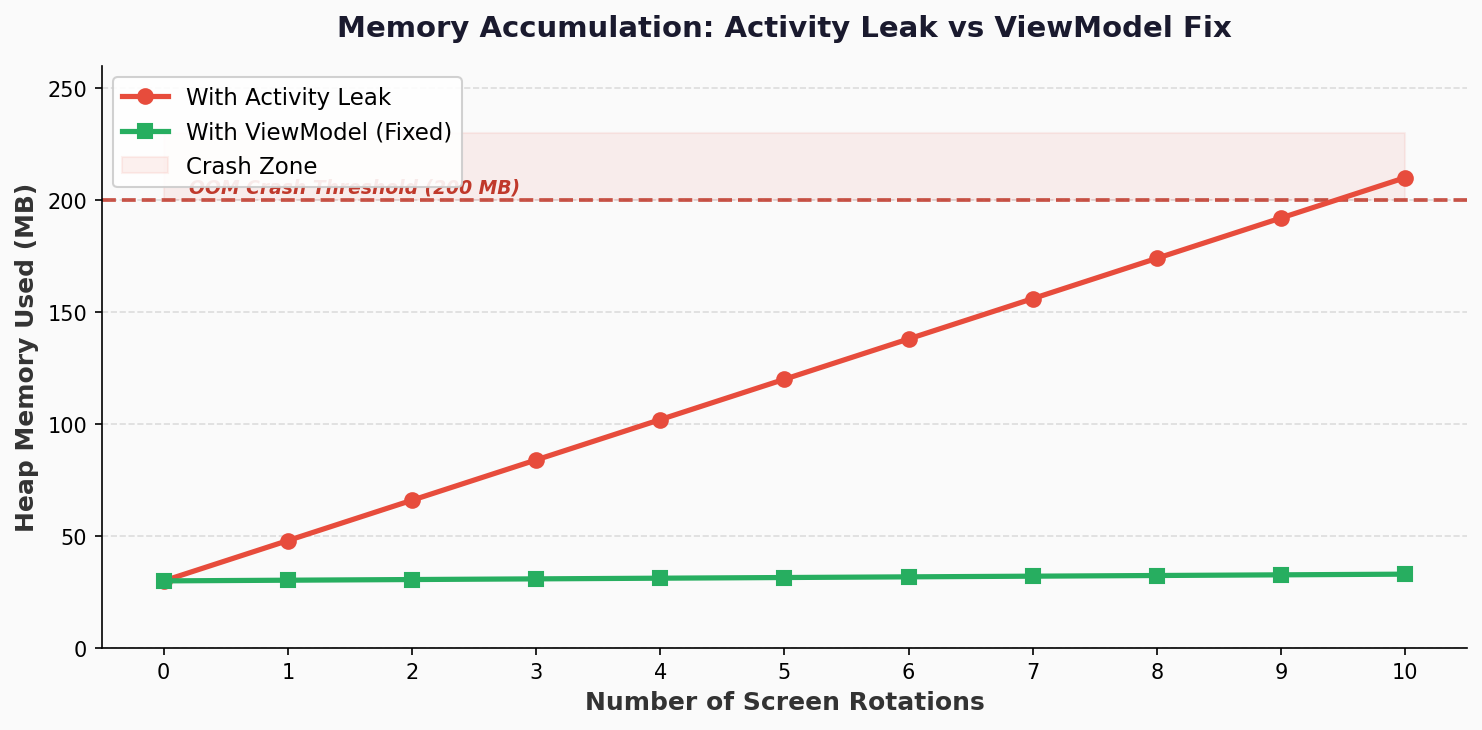
Figure 5: Heap growth over 10 screen rotations — Activity leak vs. ViewModel (no leak)
Add LeakCanary to Detect Leaks Automatically
 // build.gradle (app level) — debug builds only
 debugImplementation("com.squareup.leakcanary:leakcanary-android:2.14")
 // No initialization needed — auto-installs on debug build
Fix: Static Context Reference
 // WRONG — static reference leaks Activity
 class NetworkManager {
   companion object { var context: Context? = null }
 }


 // CORRECT — always use Application context for long-lived objects
 class NetworkManager(private val appContext: Context) {
   // Pass context.applicationContext from caller
 }
Fix: Handler Capturing Activity
 // CORRECT — use WeakReference to avoid retaining Activity
 val weakActivity = WeakReference(this)
 updateRunnable = Runnable { weakActivity.get()?.updateUI() }
 handler.postDelayed(updateRunnable!!, 5000)


 override fun onDestroy() {
   super.onDestroy()
   handler.removeCallbacks(updateRunnable!!)  // Always clean up
 }
Fix: Listener Not Unregistered
 override fun onResume() {
   super.onResume()
   locationManager.requestLocationUpdates(provider, 0, 0f, locationListener)
 }


 override fun onPause() {
   super.onPause()
   locationManager.removeUpdates(locationListener)  // Paired with onResume
 }
Step 4: Use ViewModel for Config-Change Safety
class ImageViewModel : ViewModel() {
   private val _bitmap = MutableLiveData<Bitmap?>()
   val bitmap: LiveData<Bitmap?> = _bitmap


  fun loadImage(filePath: String, w: Int, h: Int) {
      viewModelScope.launch(Dispatchers.IO) {
          _bitmap.postValue(decodeSampledBitmap(filePath, w, h))
      }
  }


  override fun onCleared() {
      super.onCleared()
      _bitmap.value?.recycle()  // Release bitmap when ViewModel is destroyed
      _bitmap.value = null
   }
 }
Step 5: Always Close Resources with use {}
 // WRONG — cursor never closed if an exception occurs mid-read
 fun getUserName(db: SQLiteDatabase, userId: Int): String? {
  val cursor = db.rawQuery("SELECT name FROM users WHERE id = ?",
                           arrayOf(userId.toString()))
   cursor.moveToFirst()
   return cursor.getString(0)
 }


 // CORRECT — use{} guarantees close() even on exception
 fun getUserName(db: SQLiteDatabase, userId: Int): String? {
   return db.rawQuery("SELECT name FROM users WHERE id = ?",
                     arrayOf(userId.toString())).use { cursor ->
      if (cursor.moveToFirst()) cursor.getString(0) else null
  }
 }
Step 6: Handle onTrimMemory to Release Caches Gracefully
 class MyApplication : Application() {
  override fun onTrimMemory(level: Int) {
      super.onTrimMemory(level)
      if (level >= ComponentCallbacks2.TRIM_MEMORY_MODERATE) {
          Glide.get(this).clearMemory()  // Release image caches under pressure
      }
  }
  override fun onLowMemory() {
      super.onLowMemory()
      Glide.get(this).clearMemory()
      FirebaseCrashlytics.getInstance().log("onLowMemory triggered")
   }
 }
WARNING: Avoid android:largeHeap="true" as a quick fix — it delays the crash but does NOT fix leaks. It increases startup time and raises the risk of the OS killing your app on low-memory devices.
Key Takeaways
Quick Diagnosis Checklist
- Run Memory Profiler and take a heap dump
- Look for high instance counts of Activity, Fragment, and Bitmap
- Check for static Context or View references
- Verify all Cursor and InputStream objects are closed
- Confirm image loading uses Glide/Coil or inSampleSize scaling
- Review Handler usage for captured Activity references
- Ensure listeners are unregistered in the correct lifecycle method
- Add LeakCanary to the debug build and reproduce the crash
Conclusion
OutOfMemoryError in Android is almost always preventable. The vast majority of real-world OOM crashes trace back to three root causes: unscaled bitmap loading, Activity/Context memory leaks, or resources not being closed.
By building good habits using Glide or Coil for images, profiling regularly with Android Studio's Memory Profiler, and catching leaks early with LeakCanary, you can eliminate OOM errors before they reach your users.
Your users' devices, especially budget Android devices in emerging markets, often have as little as 2 GB RAM. Writing memory-efficient code is not just good engineering; it is respect for your users.
Reference Links
- Android Memory Overview
- Managing Bitmap Memory
- Android Memory Profiler
- LeakCanary Docs
- Glide v4 Docs
- Coil Docs
- Paging 3 Library
- ViewModel Overview
- ComponentCallbacks2