.svg)



Introduction
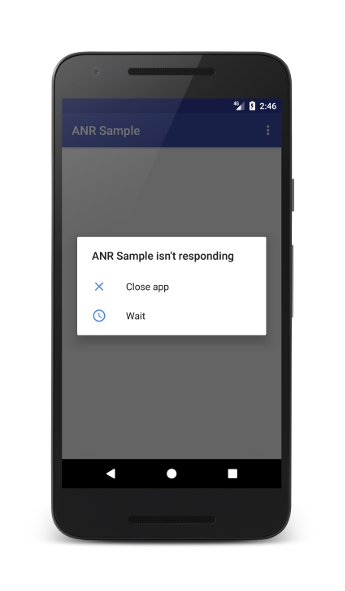
An ANR (Application Not Responding) is one of the most frustrating issues an Android developer can face. It doesn’t crash your app, but it makes it feel broken. Unlike a crash, which throws a clear stack trace, an ANR is a silent killer: the UI thread simply stops responding to user input, and Android’s watchdog steps in to ask the user whether to wait or force-close the app.
Since Android Vitals and Play Console now factor ANR rate directly into your app’s visibility and ranking, understanding how to detect, reproduce, and fix ANRs is no longer optional; it’s a core part of shipping a healthy production app.
This blog walks through a complete, reproducible workflow to debug ANR issues step by step, from spotting the symptom to shipping the fix.
Problem Statement
Android enforces strict responsiveness rules to protect the user experience:
Important: All four ANR types share one root cause: something is blocking Android’s main (UI) thread. The fix is almost always the same philosophy: move blocking work off the main thread.
The hard part isn’t knowing that it’s knowing where in your 200K-line codebase that blocking call is hiding. That’s where a structured debugging process comes in.
Understanding ANR Trace Files
When an ANR occurs, Android automatically generates a trace dump containing the stack state of every thread at the moment of the freeze. On modern Android versions, this is captured as an am_anr entry in adb logcat, and a full trace snapshot is available via:
  # Pull ANR traces from a connected device (Android 10 and below)
  adb pull /data/anr/traces.txt ./anr-traces.txt

  # On Android 11+, ANR traces are per-app and require debuggable builds
  adb shell run-as com.yourapp.package cat /data/anr/anr_*.txt > anr-trace.txt


  # Watch for ANR events live in real time
  adb logcat | grep -E "ANR in|Reason:"
A typical trace snippet looks like this:
----- pid 8452 at 2026-07-06 10:42:13 -----
   Cmd line: com.yourapp.package


   "main" prio=5 tid=1 Blocked
   | group="main" sCount=1 dsCount=0 flags=1 obj=0x72f1a3c0
   | sysTid=8452 nice=0 cgrp=default sched=0/0 handle=0x7b8e4a1c40
   | state=S schedstat=( 128340000 82910000 512 ) utm=10 stm=2 core=3
   at com.yourapp.data.UserRepository.fetchUserSync(UserRepository.java:88)
   at com.yourapp.ui.MainActivity.onCreate(MainActivity.java:45)
   - waiting to lock <0x0d3f2a10> (a java.lang.Object) held by thread 12
   at com.yourapp.network.ApiClient.getSyncResponse(ApiClient.java:120)
Read this bottom-up: the “main” thread is blocked, waiting on a lock held by another thread, while stuck inside a synchronous network call triggered from onCreate(). This single trace already tells us the exact fix needed: move fetchUserSync() off the main thread.
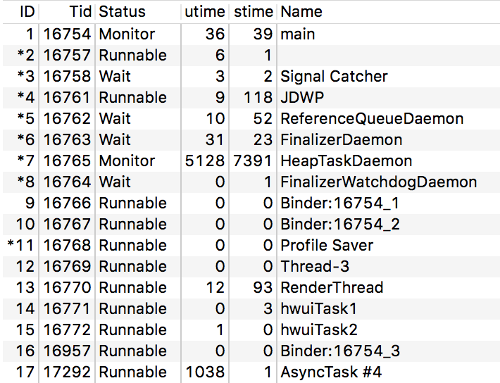
Main thread in the Monitor status, indicating it is blocked waiting on a lock
Common ANR-Causing Patterns
Blocking Network or Disk I/O on the Main Thread
   // ❌ BAD: Synchronous network call directly in onCreate()
   class MainActivity : AppCompatActivity() {
   override fun onCreate(savedInstanceState: Bundle?) {
       super.onCreate(savedInstanceState)
       setContentView(R.layout.activity_main)


       // This blocks the UI thread until the network responds
       val user = ApiClient.getSyncResponse("/user/profile")
       bindUserData(user)
   }
   }
   // ✅ GOOD: Move I/O to a background coroutine
   class MainActivity : AppCompatActivity() {
   override fun onCreate(savedInstanceState: Bundle?) {
       super.onCreate(savedInstanceState)
       setContentView(R.layout.activity_main)


       lifecycleScope.launch {
           // Dispatchers.IO keeps this off the main thread
           val user = withContext(Dispatchers.IO) {
               ApiClient.getSyncResponse("/user/profile")
           }
           bindUserData(user) // back on Main automatically
       }
   }
   }
Deadlocks from Synchronized Blocks
   // ❌ BAD: Two threads locking objects in reverse order — classic deadlock
   class CacheManager {
   private val lockA = Any()
   private val lockB = Any()


   fun writeFromMainThread() {
       synchronized(lockA) {
           synchronized(lockB) { /* ... */ }
       }
   }


   fun writeFromWorkerThread() {
       synchronized(lockB) {
           synchronized(lockA) { /* ... */ } // reversed order -> deadlock risk
       }
   }
   }
Fix: Always acquire locks in the same global order across every thread, or replace nested locks with a single Mutex / ReentrantLock guarding the whole critical section.
Heavy Work Inside BroadcastReceiver.onReceive()
   // ❌ BAD: onReceive() has a hard 10-second limit
   class SyncReceiver : BroadcastReceiver() {
   override fun onReceive(context: Context, intent: Intent) {
       // Runs synchronously on the main thread — dangerous!
       val data = DatabaseHelper.getInstance(context).heavyQuery()
       processData(data)
   }
   }
   // ✅ GOOD: Delegate to WorkManager instead
   class SyncReceiver : BroadcastReceiver() {
   override fun onReceive(context: Context, intent: Intent) {
       val request = OneTimeWorkRequestBuilder<SyncWorker>().build()
       WorkManager.getInstance(context).enqueue(request)
   }
   }
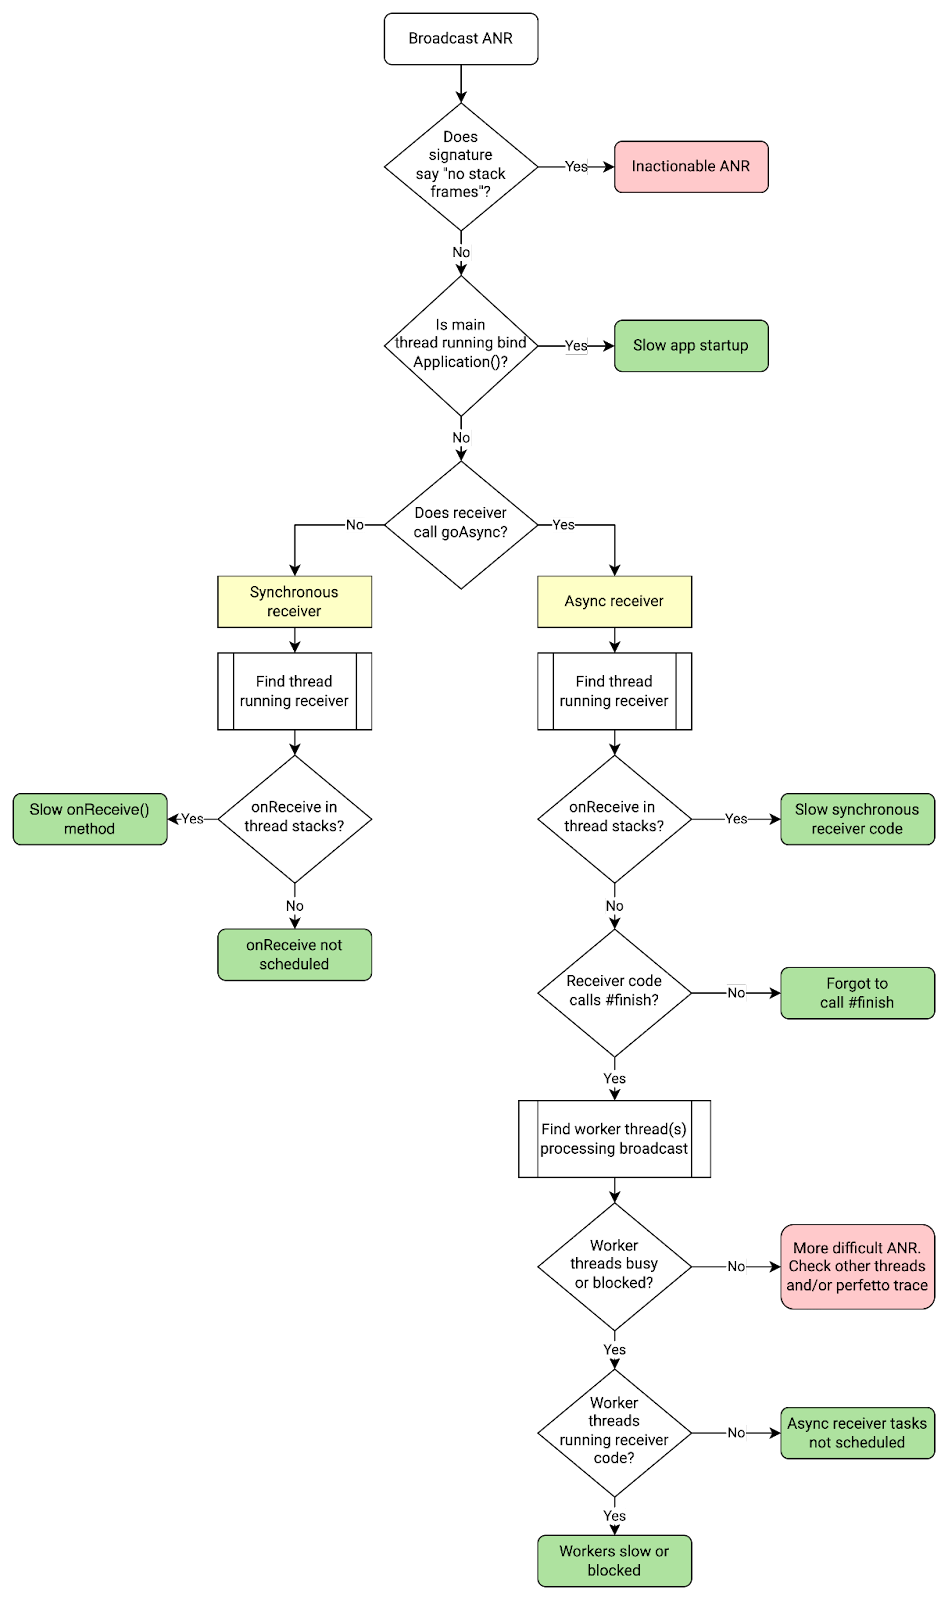
Flowchart for debugging a broadcast receiver timeout ANR.
Pros and Cons of Common Debugging Tools
Step-by-Step Debugging Workflow
Step 1: Enable StrictMode in Debug Builds
   // Application.kt — catch violations the moment they happen
   class MyApplication : Application() {
   override fun onCreate() {
       super.onCreate()
       if (BuildConfig.DEBUG) {
           StrictMode.setThreadPolicy(
               StrictMode.ThreadPolicy.Builder()
                   .detectDiskReads()
                   .detectDiskWrites()
                   .detectNetwork()
                   .penaltyLog()
                   .build()
           )
       }
   }
   }
Step 2: Reproduce the ANR Locally
   # Simulate an ANR manually for testing (debug builds only)
   adb shell am hang --allow-restart


   # Or trigger via the app's own "Force ANR" debug menu if you've added one
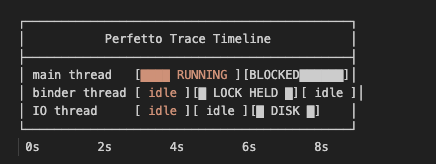
Step 3: Capture a System Trace with Perfetto
   # Record a 10-second system trace while reproducing the freeze
   adb shell perfetto -o /data/misc/perfetto-traces/trace.perfetto -t 10s sched freq idle am wm gfx view


   # Pull and open in https://ui.perfetto.dev
   adb pull /data/misc/perfetto-traces/trace.perfetto ./
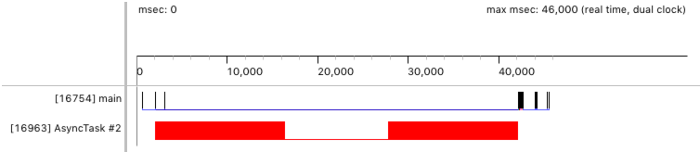
Traceview timeline showing work executed on a worker thread while the main thread is locked
Step 4: Read the ANR Trace and Isolate the Blocking Call
Pull the trace (see Section 3) and locate the “main” thread state. Trace backward from the topmost frame to find the exact method call that blocked.
Step 5: Fix and Verify
Apply the appropriate fix pattern from Section 4, then re-run Step 2 and Step 3 to confirm the main thread stays in a RUNNABLE/SUSPENDED state without ever blocking past the timeout threshold.
Step 6: Monitor in Production
   # Check ANR rate via Play Console Vitals API (requires Google Play Developer API access)
   curl -X GET \
   "https://playdeveloperreporting.googleapis.com/v1beta1/apps/com.yourapp.package/anrRateMetricSet:query" \
   -H "Authorization: Bearer $ACCESS_TOKEN"
Integrate App’s crash and ANR monitoring SDK to get symbolicated ANR traces with full session context (device, OS version, memory state) delivered to your dashboard in real time; no need to wait for the next Play Console sync cycle.
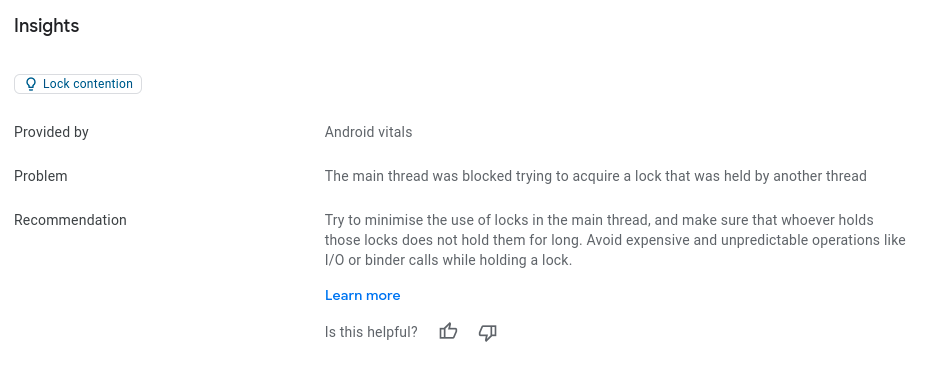
Play Vitals ANR detection showing lock contention insights and recommended fixes
Comparison: ANR Detection Methods
Key Takeaways
- An ANR means the main thread was blocked past Android’s timeout threshold — always start debugging there.
- ANR trace files are read bottom-up on the “main” thread to find the exact blocking call.
- The fix pattern is almost always: move I/O, heavy computation, or locks off the main thread using coroutines, WorkManager, or background threads.
- Use StrictMode during development to catch violations before they ever reach production.
- Use Perfetto for deep system-level diagnosis when the cause isn’t obvious from the trace alone.
- Monitor ANR rate continuously in production: Google Play factors this into app visibility, so real-time alerting closes the feedback loop faster than waiting on the Play Console.
Conclusion
ANRs are one of the clearest signals that something in your app’s threading model needs attention. The good news is that the debugging process is highly repeatable: capture the trace, read the main thread state, isolate the blocking call, apply the standard off-main-thread fix, and verify with a system trace before shipping.
Treat your ANR rate the same way you treat your crash-free rate as a first-class production health metric, monitored continuously rather than checked only when Play Console sends a warning email.
References
- Android Developers ANRs Overview
- Android Developers Diagnose and Fix ANRs
- Android Developers StrictMode API Reference
- Perfetto System Tracing Documentation
- Android Developers WorkManager Overview
- Google Play Console Android Vitals