.png)


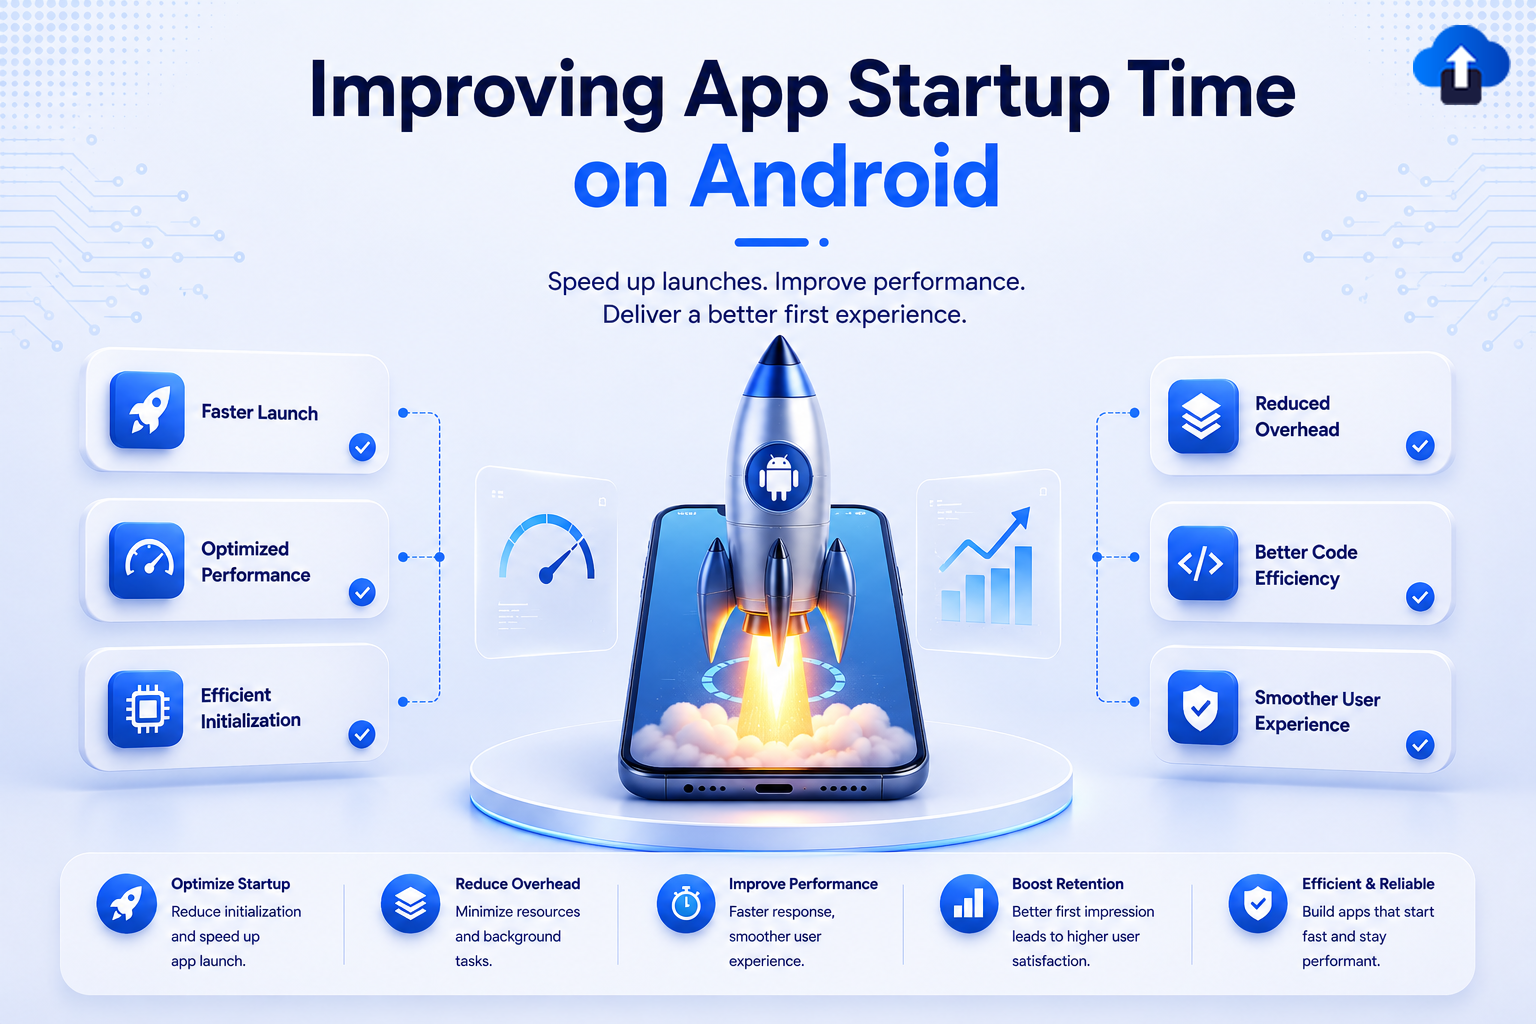
“You tap the app icon. One second passes. Two seconds. Three. By the time the home screen finally appears, your user has already switched to a competitor’s app.” This isn’t a network problem. It’s not a server problem. It’s a startup problem, and it’s 100% fixable.
Introduction
First impressions are everything in people and in apps. Research from Google shows that 53% of users abandon an app if it takes more than 3 seconds to load. On Android, startup time directly influences your Play Store rating, user retention, and ultimately, revenue.
Whether you are building a new project or optimizing a legacy app with years of accumulated technical debt, this guide provides a systematic, measurable path to faster startup. Every technique here is battle-tested, SDK-verified, and backed by official Android documentation.
Problem Statement
What Makes Android Apps Start Slowly?
When Android launches your app, it does not simply “open” it. A chain of events must be completed before the user can interact with anything. The longer this chain, the worse the perceived performance.
Common culprits include:
- Heavy Application.onCreate(): initializing SDKs, databases, analytics, crash reporters all at once
- Synchronous I/O on the main thread: reading SharedPreferences, databases, or files before the UI is ready
- Overdraw and layout inflation: complex XML hierarchies taking too long to inflate
- Unoptimized dependency injection: Dagger/Hilt component creation happens eagerly
- Missing baseline profiles: the ART runtime interprets bytecode instead of running compiled machine code on first launch
Warning: Android Vitals in the Google Play Console flags apps with Cold Startup > 5 seconds as having “poor” startup. Apps consistently above this threshold can be penalized in search rankings.
Understanding Android App Startup Types
Before optimizing, you must know which startup you are targeting.
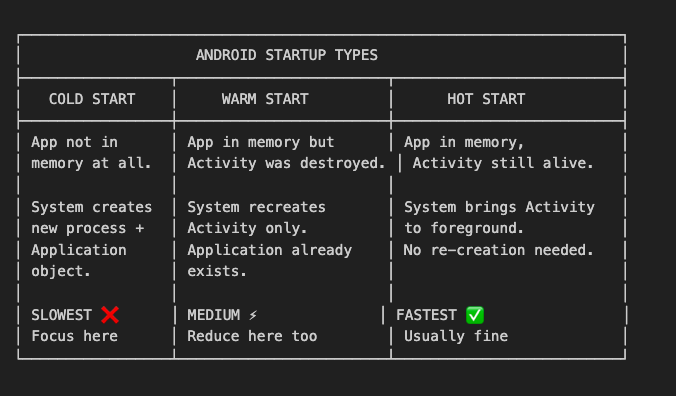
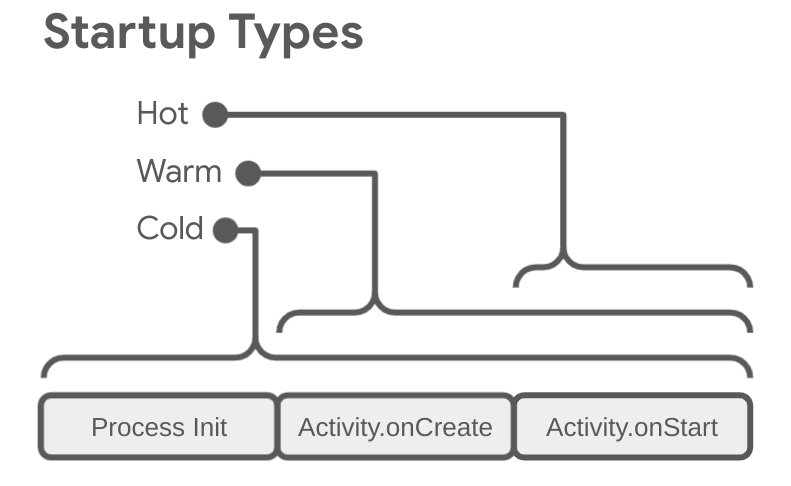
Cold, Warm, and Hot startup modes official Android developer documentation.
Startup Phases During a Cold Start
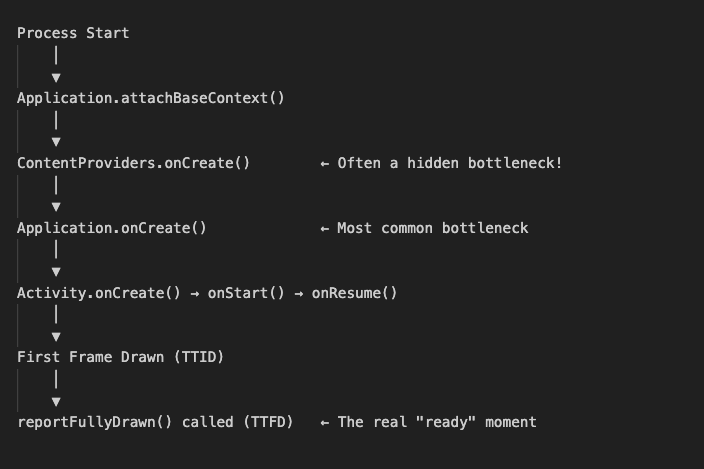
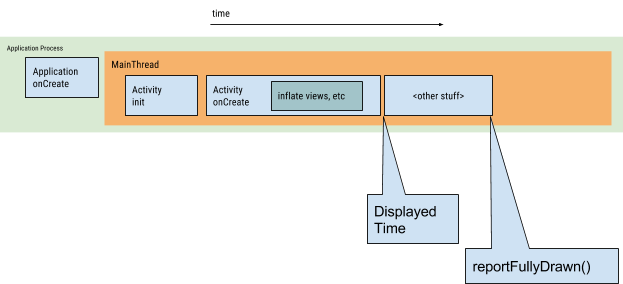
Android cold app launch lifecycle from process creation to first frame drawn
(source: developer.android.com).
Key Metrics:
- TTID (Time to Initial Display): time until the first frame is drawn
- TTFD (Time to Full Display): time until all content is loaded and interactive
Profiling Tools: Diagnose Before You Fix
Warning: Never optimize blindly. Always profile first. Guessing which part of the startup is slow wastes time and can introduce regressions.
Android Studio App Startup Profiler
Android Studio Hedgehog (2023.1.1+) includes a dedicated App Startup profiler track.
Steps:
- Open Profiler → CPU
- Select Java/Kotlin Method Trace or System Trace
- Launch your app and observe the flame chart
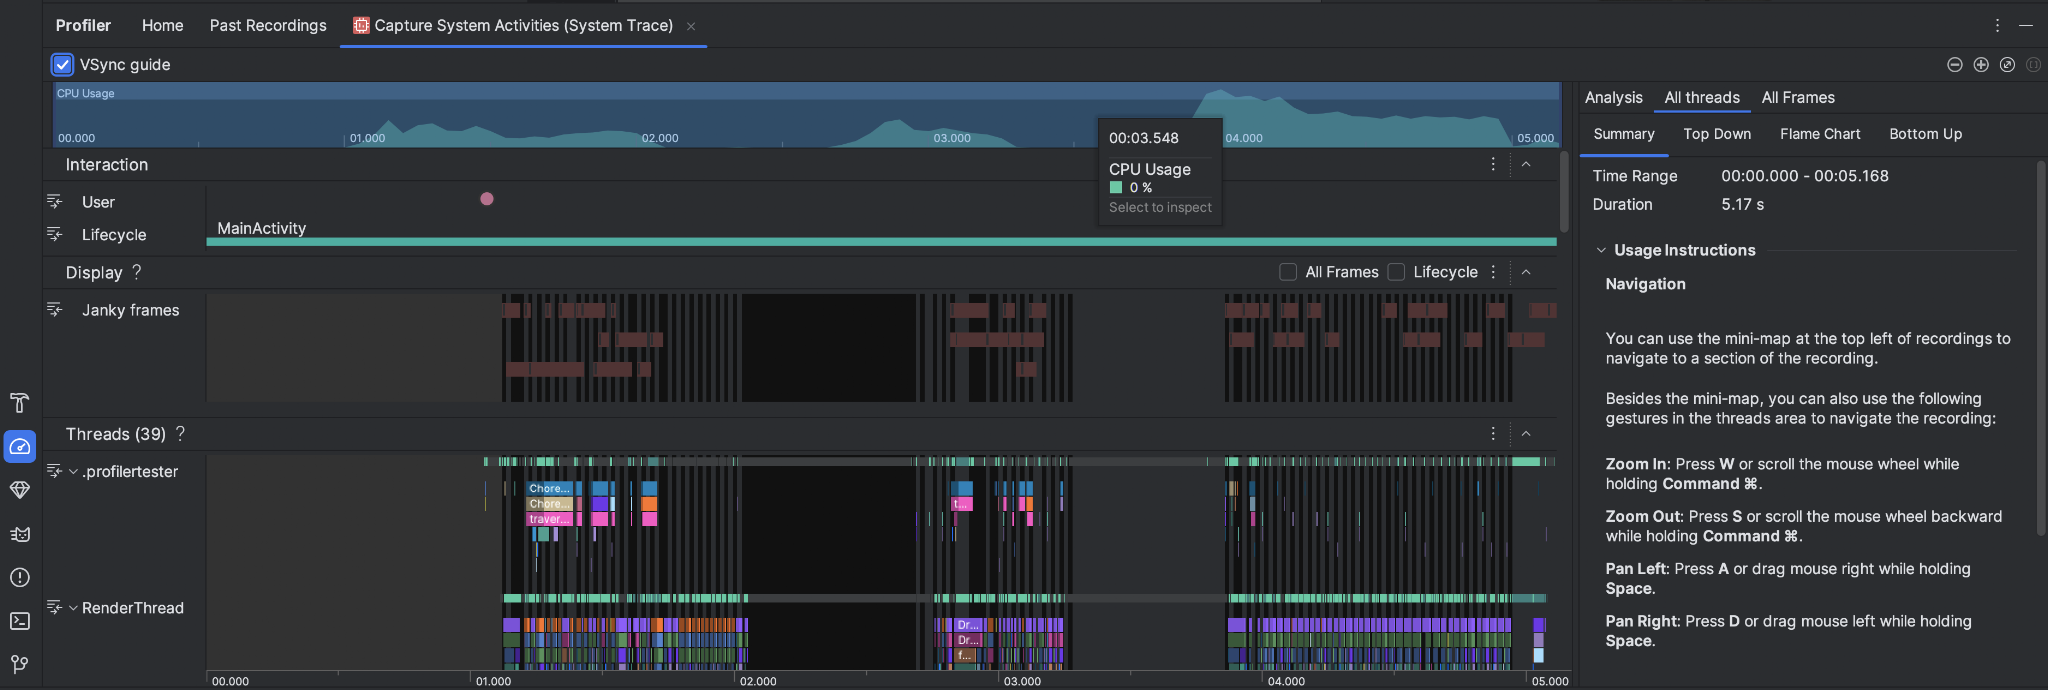
Android Studio System Trace CPU profiler view showing thread activity during app startup
(source: developer.android.com).
Perfetto Trace
Perfetto gives system-level insight, including binder calls, I/O waits, and lock contention.
# Capture a Perfetto trace during cold start
adb shell perfetto \
-c - --txt \
-o /data/misc/perfetto-traces/trace \
<<EOF
buffers: {
size_kb: 63488
fill_policy: DISCARD
}
data_sources: {
config {
 name: "linux.process_stats"
}
}
data_sources: {
config {
 name: "track_event"
 target_buffer: 0
}
}
duration_ms: 10000
EOF


# Pull the trace file to your machine
adb pull /data/misc/perfetto-traces/trace ~/Desktop/startup_trace
Open the pulled file at ui.perfetto.dev for visualization.
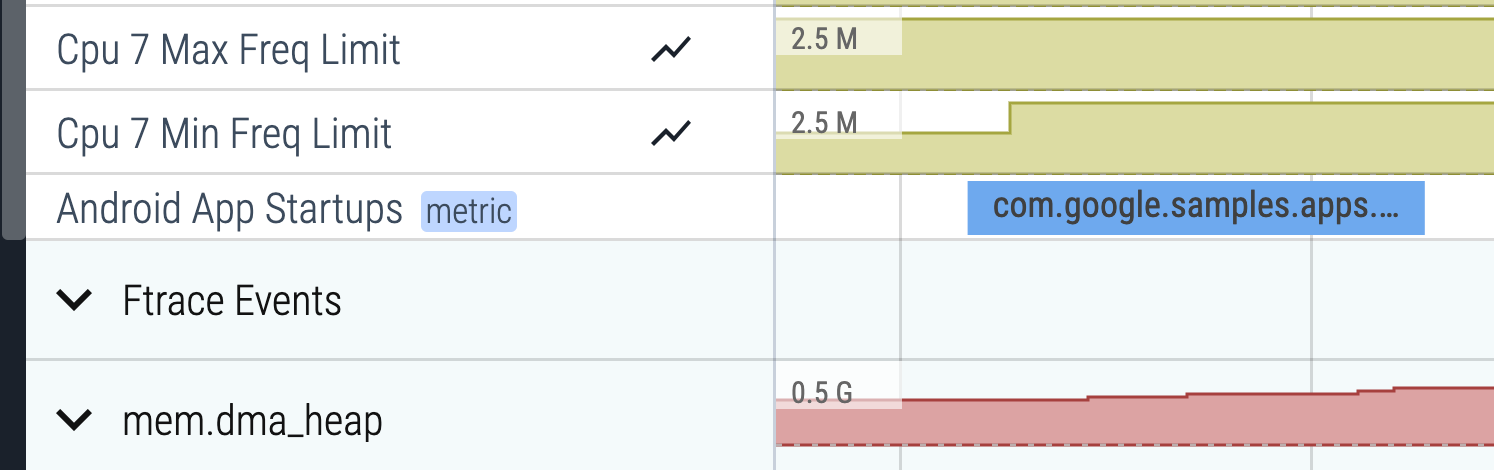
Perfetto trace Android App Startups derived metric showing TTID and TTFD markers
(source: developer.android.com).
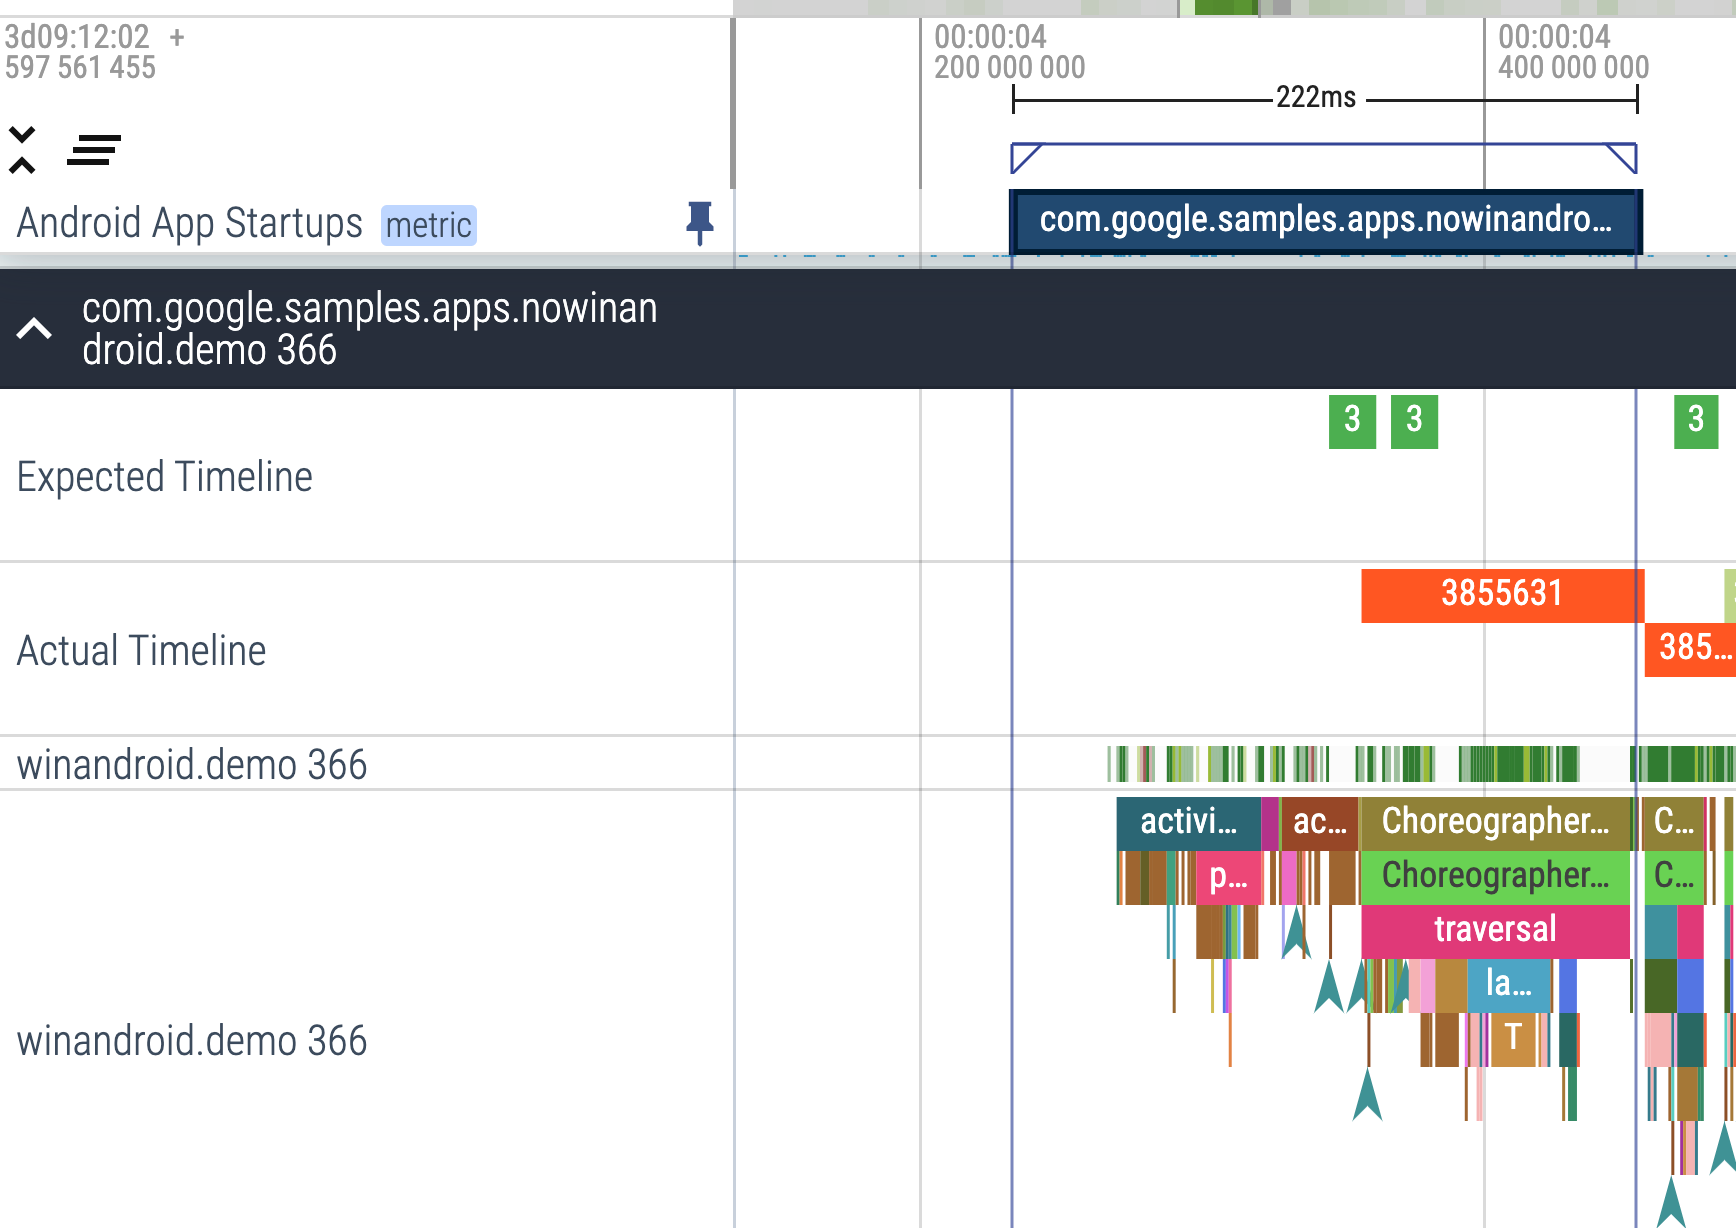
Perfetto zoomed view inspects individual thread activity during cold startup
(source: developer.android.com).
reportFullyDrawn() Measuring TTFD
class MainActivity : AppCompatActivity() {


 override fun onCreate(savedInstanceState: Bundle?) {
 super.onCreate(savedInstanceState)
 setContentView(R.layout.activity_main)


 // Trigger async content load (e.g., fetch from Room DB)
 viewModel.homeData.observe(this) { data ->
 adapter.submitList(data)


 // Call ONLY after real content is visible to the user
 reportFullyDrawn()
 }
 }
}
Check logcat for the output:
I ActivityTaskManager: Fully drawn com.example.app/.MainActivity: +1s234ms
Macrobenchmark Automated Startup Benchmarking
Add the Macrobenchmark dependency to a separate benchmark module:
// benchmark/build.gradle.kts
dependencies {
 implementation("androidx.benchmark:benchmark-macro-junit4:1.3.0")
}
// StartupBenchmark.kt
@RunWith(AndroidJUnit4::class)
class StartupBenchmark {


 @get:Rule
 val benchmarkRule = MacrobenchmarkRule()


 @Test
 fun startupCold() = benchmarkRule.measureRepeated(
 packageName = "com.example.myapp",
 metrics = listOf(StartupTimingMetric()),
 iterations = 10,
 startupMode = StartupMode.COLD,
 setupBlock = {
 // Kill the app process before each iteration
 pressHome()
 }
 ) {
 startActivityAndWait()
 }
}
# Run the benchmark from terminal
./gradlew :benchmark:connectedBenchmarkAndroidTest \
-Pandroid.testInstrumentationRunnerArguments.androidx.benchmark.enabledRules=Macrobenchmark
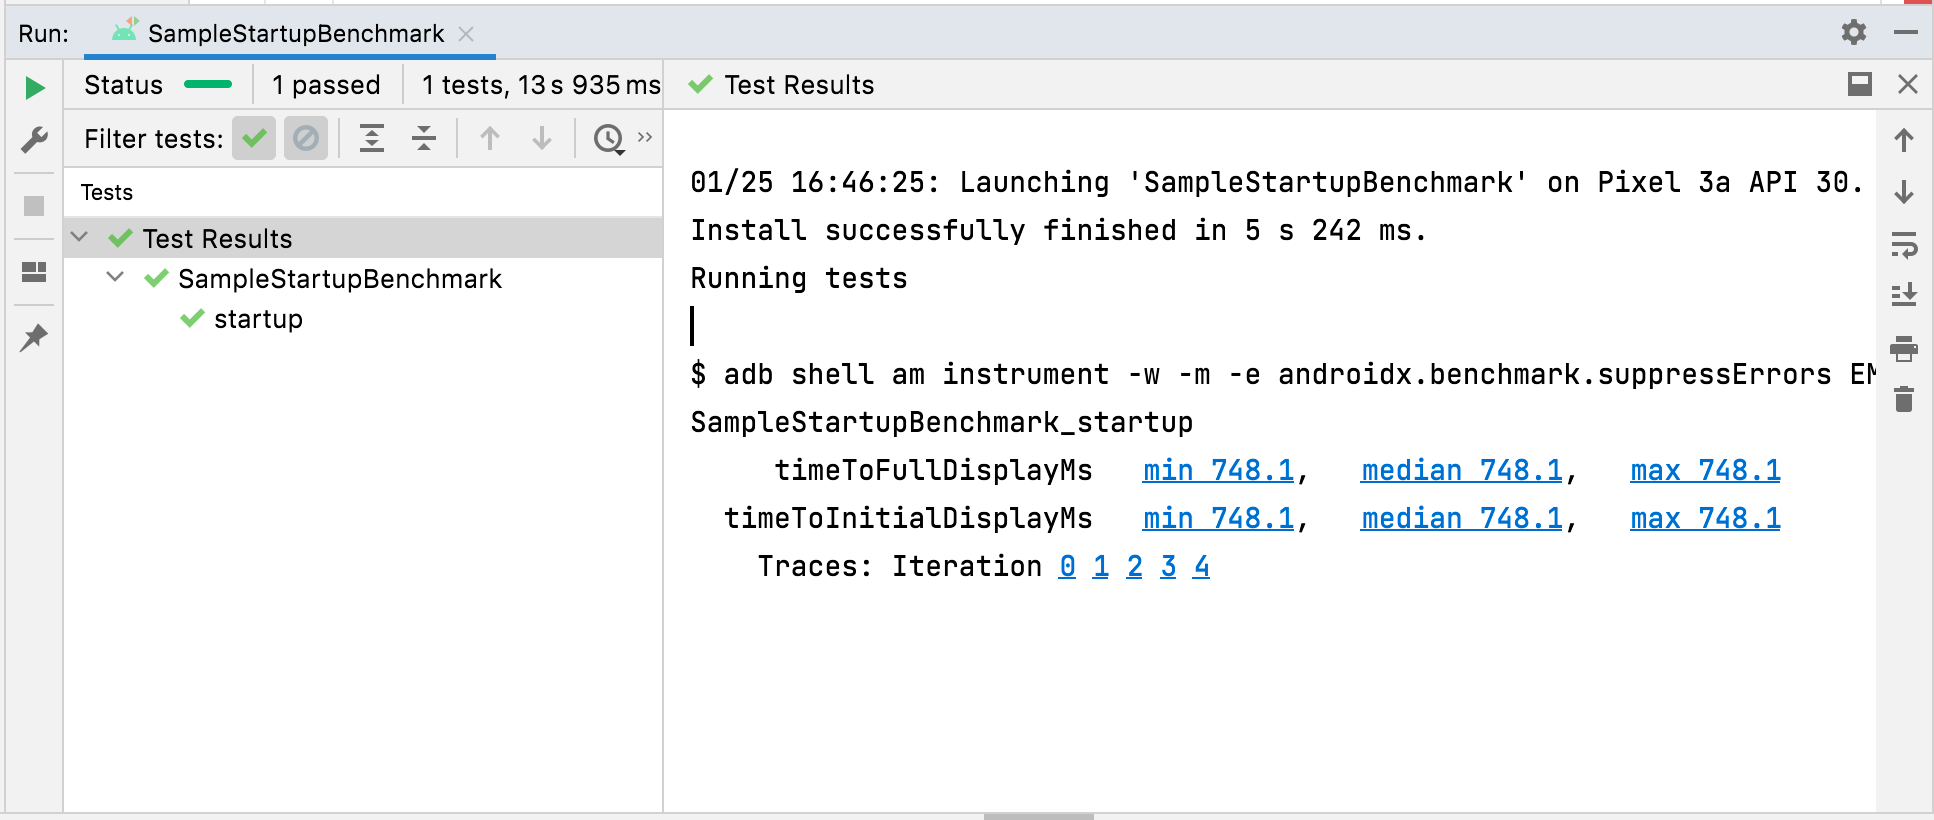
Macrobenchmark startup results — median, min, and max TTID across iterations displayed in AndroidStudio
(source: developer.android.com).
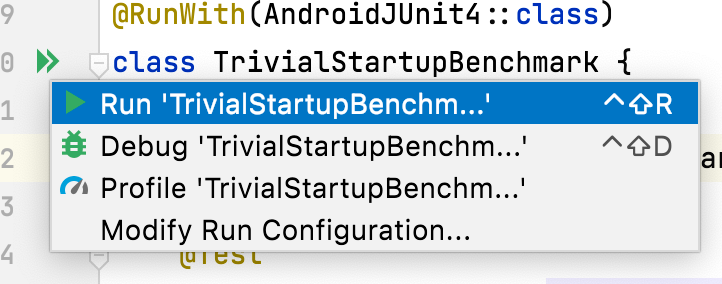
Running a Macrobenchmark test directly from the Android Studio gutter
(source: developer.android.com).
Optimization Techniques
Lazy-Initialize Heavy SDKs in Application.onCreate()
The most impactful change you can make: defer everything that isn’t needed before the first frame.
Before (Slow everything blocking main thread):
class MyApp : Application() {


 override fun onCreate() {
 super.onCreate()


 // ❌ All of these block the main thread at startup
 FirebaseApp.initializeApp(this)
 Timber.plant(Timber.DebugTree())
 MixpanelAPI.getInstance(this, "YOUR_TOKEN")
 Room.databaseBuilder(this, AppDatabase::class.java, "app-db").build()
 FacebookSdk.sdkInitialize(this)
 }
}
After (Fast only critical init on main thread, rest deferred):
class MyApp : Application() {


 override fun onCreate() {
 super.onCreate()


 // ✅ Only crash reporter and logging are truly needed immediately
 FirebaseCrashlytics.getInstance().setCrashlyticsCollectionEnabled(true)
 if (BuildConfig.DEBUG) Timber.plant(Timber.DebugTree())


 // ✅ Everything else deferred to a background thread
 AppInitializer.getInstance(this)
 .initializeComponent(AnalyticsInitializer::class.java)
 }
}
App Startup Library Structured Lazy Initialization
The Jetpack App Startup library (androidx.startup) gives you controlled, ordered initialization of components with minimal boilerplate.
// build.gradle.kts (app module)
dependencies {
 implementation("androidx.startup:startup-runtime:1.1.1")
}
Create an initializer for each SDK:
// AnalyticsInitializer.kt
class AnalyticsInitializer : Initializer<MixpanelAPI> {


 override fun create(context: Context): MixpanelAPI {
 // Runs on a background thread — safe for heavy init
 return MixpanelAPI.getInstance(context, BuildConfig.MIXPANEL_TOKEN)
 }


 override fun dependencies(): List<Class<out Initializer<*>>> {
 // Declare if this initializer depends on another
 return emptyList()
 }
}
// DatabaseInitializer.kt
class DatabaseInitializer : Initializer<AppDatabase> {


 override fun create(context: Context): AppDatabase {
 return Room.databaseBuilder(
 context.applicationContext,
 AppDatabase::class.java,
 "app-database"
 ).build()
 }


 override fun dependencies(): List<Class<out Initializer<*>>> = emptyList()
}
Declare in AndroidManifest.xml:
<provider
 android:name="androidx.startup.InitializationProvider"
 android:authorities="${applicationId}.androidx-startup"
 android:exported="false"
 tools:node="merge">


 <!-- Remove this entry to disable automatic init; call manually instead -->
 <meta-data
 android:name="com.example.myapp.AnalyticsInitializer"
 android:value="androidx.startup" />


</provider>
Manually trigger when needed (lazy on-demand):
// In your ViewModel or Repository — only when analytics is first needed
val analytics = AppInitializer.getInstance(context)
 .initializeComponent(AnalyticsInitializer::class.java)
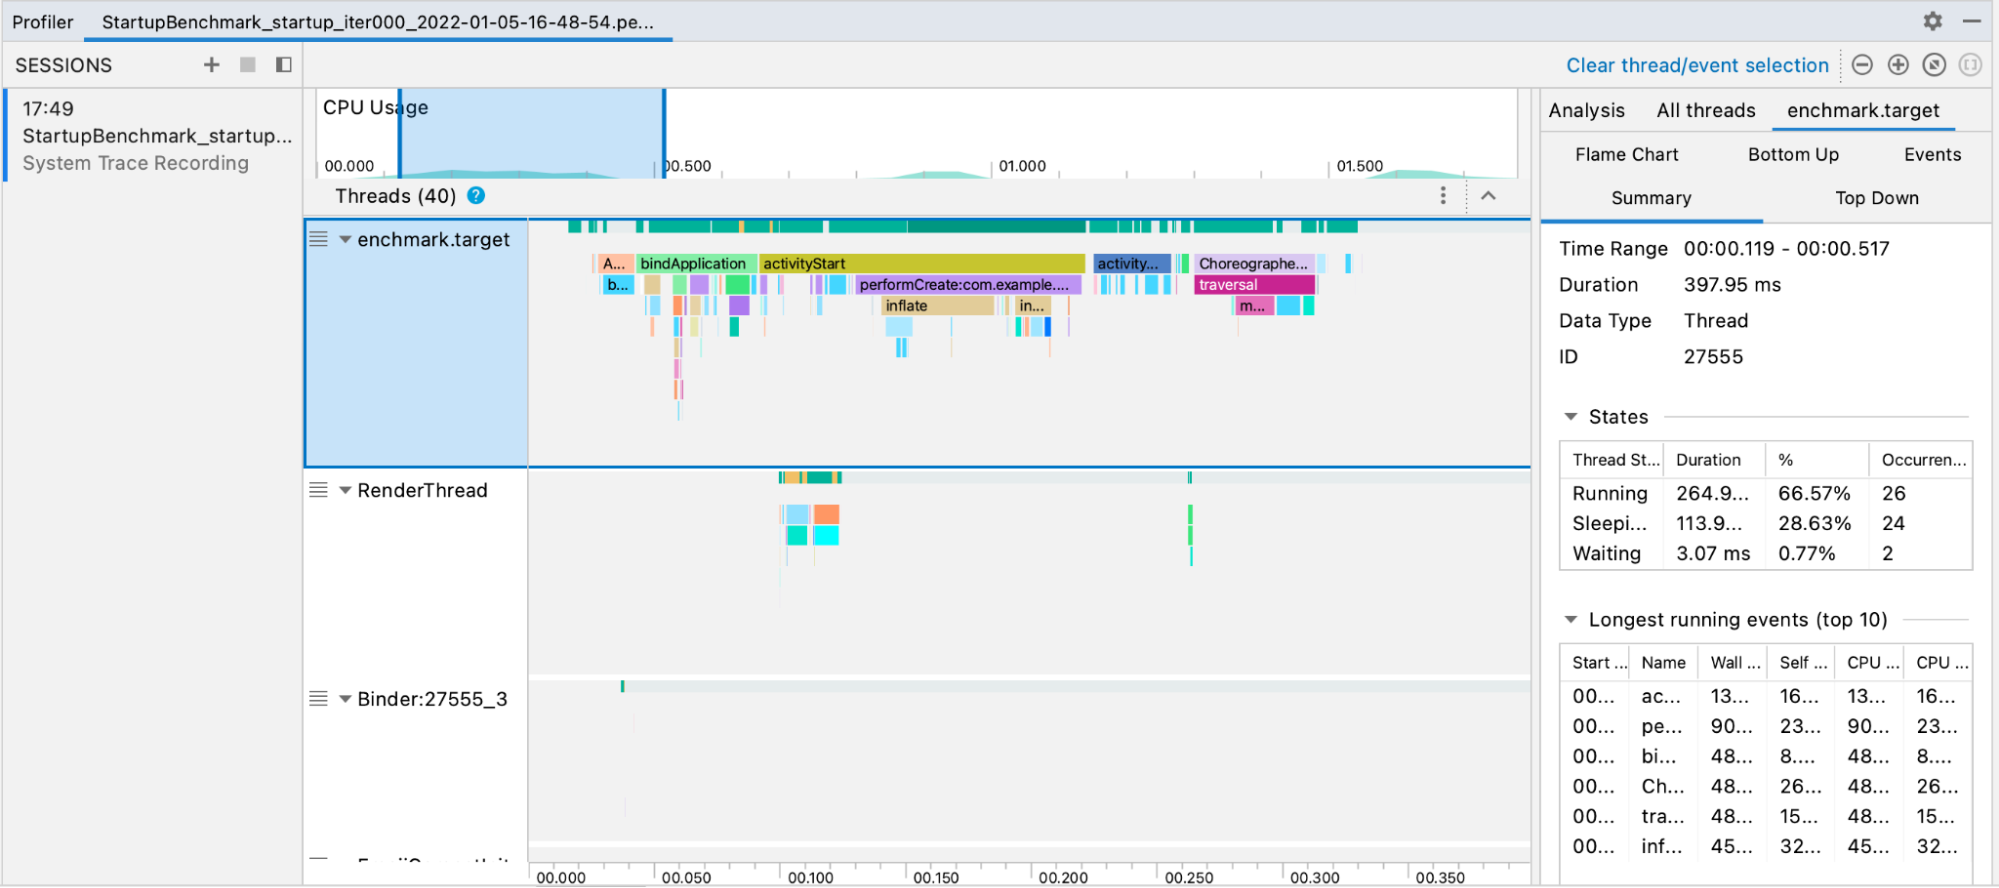
Macrobenchmark trace analysis opens startup traces directly in Android Studio for deep-dive profiling
(source: developer.android.com).
Baseline Profiles Compile Before First Launch
Baseline Profiles tell the Android Runtime (ART) which classes and methods to AOT-compile before the user first launches your app. The result: 30–40% faster cold starts from day one.
// baselineprofile/src/main/kotlin/BaselineProfileGenerator.kt
@RunWith(AndroidJUnit4::class)
@RequiresDevice
class BaselineProfileGenerator {


 @get:Rule
 val rule = BaselineProfileRule()


 @Test
 fun generateBaselineProfile() {
 rule.collect(
 packageName = "com.example.myapp",
 profileBlock = {
 // Simulate the most common user journey
 startActivityAndWait()


 // Navigate the critical path
 device.findObject(By.text("Feed")).click()
 device.waitForIdle()
 }
 )
 }
}
# Generate the baseline profile
./gradlew :app:generateBaselineProfile


# Output: app/src/main/baseline-prof.txt
// app/build.gradle.kts — enable profile installation
android {
 buildTypes {
 release {
 // Installs baseline profile in release builds
 }
 }
}


dependencies {
 implementation("androidx.profileinstaller:profileinstaller:1.3.1")
}
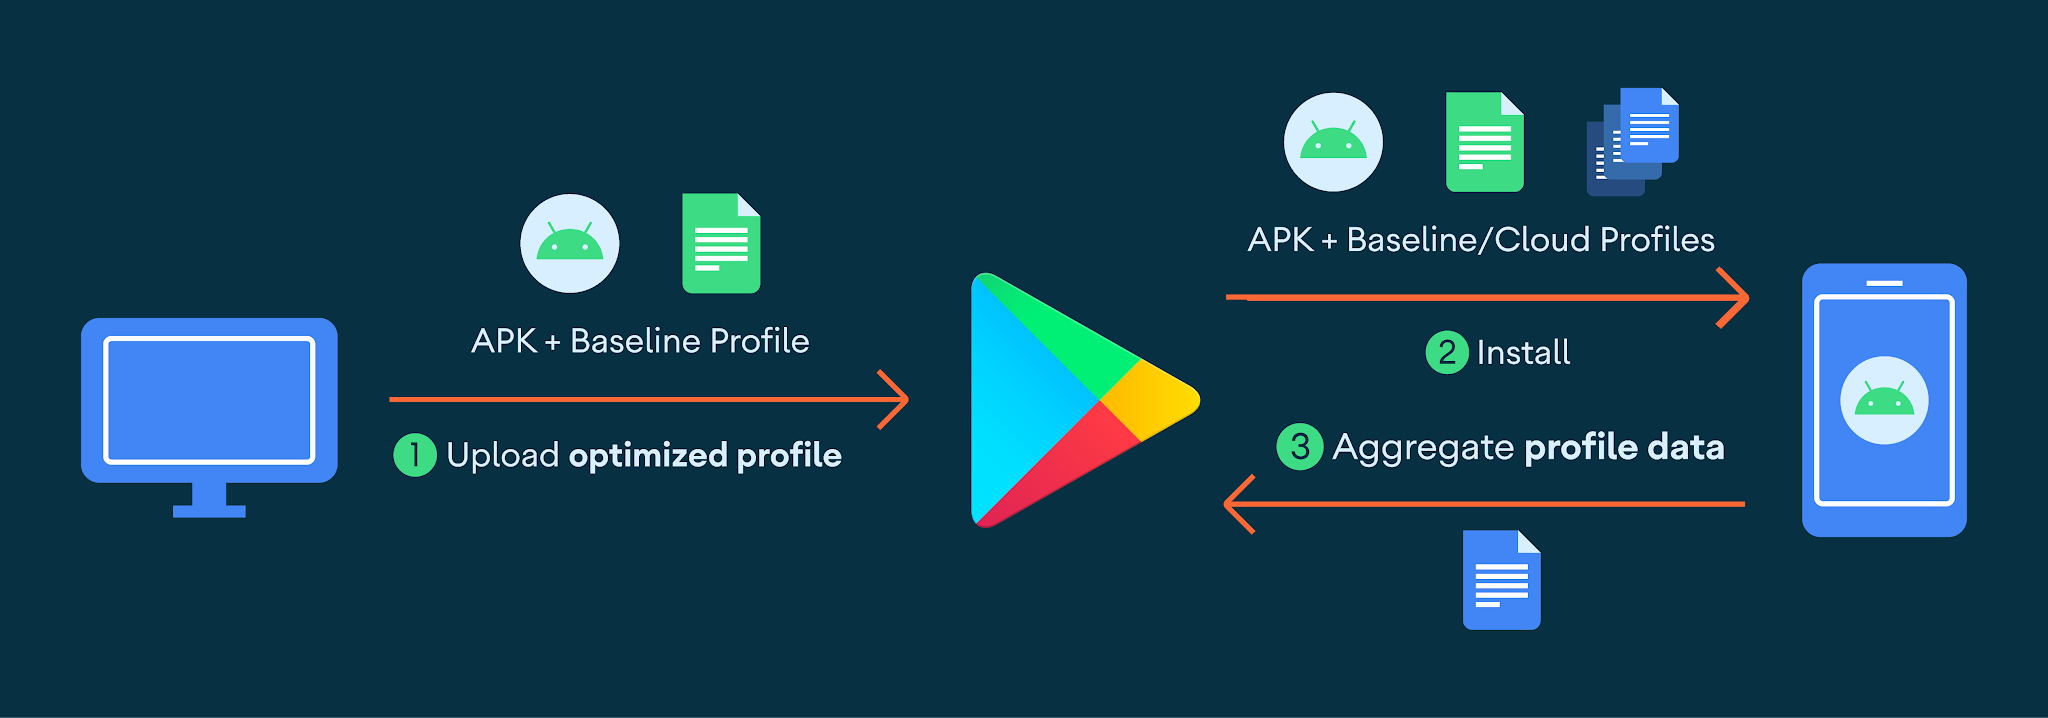
Baseline Profile workflow from profile generation to ART AOT compilation during Play Store install
(source: developer.android.com).
Warning: Baseline Profiles only take effect in release builds installed via the Play Store or using adb install. Debug builds do not benefit from them.
Optimize Layout Inflation
Complex view hierarchies inflate slowly. Use these strategies:
Use ViewStub for views not needed immediately:
<!-- activity_main.xml -->
<ViewStub
 android:id="@+id/stub_onboarding"
 android:layout="@layout/layout_onboarding"
 android:layout_width="match_parent"
 android:layout_height="match_parent" />
// Inflate only when actually needed
val stub = findViewById<ViewStub>(R.id.stub_onboarding)
if (isFirstLaunch) {
 stub.inflate() // Only now does it parse and add to the view tree
}
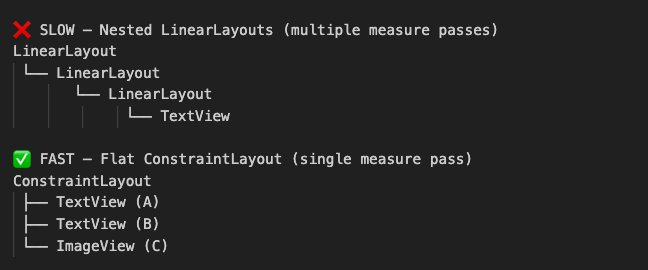
Prefer ConstraintLayout over nested layouts:
Use WindowBackground to eliminate the visual blank screen:
!-- res/values/themes.xml -->
<style name="Theme.MyApp.Splash" parent="Theme.AppCompat.NoActionBar">
 <!-- Show a branded drawable instantly while the app loads -->
 <item name="android:windowBackground">@drawable/splash_screen</item>
 <item name="android:windowFullscreen">true</item>
</style>
<!-- AndroidManifest.xml — apply only to launcher Activity -->
<activity
 android:name=".MainActivity"
 android:theme="@style/Theme.MyApp.Splash">
 <intent-filter>
 <action android:name="android.intent.action.MAIN" />
 <category android:name="android.intent.category.LAUNCHER" />
 </intent-filter>
</activity>
Custom Image Needed: Side-by-side device screenshot left: blank white launch screen (no splash theme); right: branded splash screen with logo using windowBackground dimensions: 800×600px.
Avoid Synchronous SharedPreferences on Startup
SharedPreferences.getSharedPreferences() reads from disk synchronously on the first call.
// ❌ WRONG — Blocks the main thread during cold start
class MyApp : Application() {
 override fun onCreate() {
 val prefs = getSharedPreferences("config", MODE_PRIVATE)
 val userId = prefs.getString("user_id", null) // Disk read on main thread!
 }
}


// ✅ CORRECT — Migrate to DataStore with coroutines (non-blocking)
class UserRepository(private val dataStore: DataStore<Preferences>) {


 val userId: Flow<String?> = dataStore.data
 .catch { emit(emptyPreferences()) }
 .map { prefs -> prefs[PreferencesKeys.USER_ID] }


 suspend fun saveUserId(id: String) {
 dataStore.edit { prefs ->
 prefs[PreferencesKeys.USER_ID] = id
 }
 }


 companion object {
 val USER_ID = stringPreferencesKey("user_id")
 }
}
Hilt Lazy Component Initialization
When using Hilt, avoid initializing all dependencies at startup. Use@ActivityRetainedScoped or lazy injection:
// ❌ WRONG — Eager injection of heavy dependency at Activity creation
@AndroidEntryPoint
class MainActivity : AppCompatActivity() {


 @Inject lateinit var heavyAnalyticsEngine: HeavyAnalyticsEngine // Created at onCreate!
}


// ✅ CORRECT — Lazy injection — created only on first access
@AndroidEntryPoint
class MainActivity : AppCompatActivity() {


 @Inject lateinit var heavyAnalyticsEngineProvider: Provider<HeavyAnalyticsEngine>


 private val analyticsEngine by lazy { heavyAnalyticsEngineProvider.get() }


 fun onUserAction() {
 analyticsEngine.track("user_action") // Created here, not at startup
 }
}
Optimization Techniques Comparison Table
Custom Image Needed: Horizontal bar chart startup impact of all 10 optimization techniques, color-coded (red = high impact not applied, green = applied) dimensions: 1000×600px.
Full Implementation: Before and After
Startup Flow Comparison
BEFORE OPTIMIZATION
────────────────────────────────────────────────────────
Process Start
│── Application.onCreate() ............... 1800ms ❌
│ ├── Firebase.init() ................... 320ms
│ ├── MixpanelAPI.init() ................ 280ms
│ ├── Room.build() ...................... 450ms
│ ├── FacebookSdk.init() ................ 390ms
│ └── SharedPreferences read ............. 80ms (disk)
│── ContentProvider.onCreate() ............. 200ms ❌
│── MainActivity.onCreate() ................ 450ms
│── Layout Inflation ....................... 380ms ❌
└── TTID ................................ ~2830ms 🔴


AFTER OPTIMIZATION
────────────────────────────────────────────────────────
Process Start
│── Application.onCreate() ................ 120ms ✅
│ ├── Crashlytics (critical only) ........ 80ms
│ └── Timber.plant() ..................... 40ms
│── ContentProvider.onCreate() .............. 10ms ✅
│── MainActivity.onCreate() ................ 160ms
│── Layout Inflation (ConstraintLayout) .... 120ms ✅
│── [Background: SDKs init async] ......... parallel
└── TTID ................................ ~410ms 🟢
Improvement: 2830ms → 410ms = 85% faster cold start
Custom Image Needed: Split-screen Pixel 7a device mockup left: blank spinner for ~3 seconds (unoptimized); right: branded content visible under 500ms (optimized). Dimensions: 1200×700px.
Putting It All Together: Optimized Application Class
// MyApp.kt
@HiltAndroidApp
class MyApp : Application() {


 override fun onCreate() {
 super.onCreate()


 // ✅ Only truly critical — crash reporting must start immediately
 FirebaseCrashlytics.getInstance()
 .setCrashlyticsCollectionEnabled(!BuildConfig.DEBUG)


 // ✅ Debug logging only
 if (BuildConfig.DEBUG) {
 Timber.plant(Timber.DebugTree())
 }


 // ✅ Everything else deferred via App Startup library
 // Declared in AndroidManifest.xml — runs lazily on a background thread
 // No explicit call needed here
 }
}
// AppInitializers.kt


/** Initializes analytics SDK — deferred, runs on background thread */
class MixpanelInitializer : Initializer<MixpanelAPI> {
 override fun create(context: Context): MixpanelAPI =
 MixpanelAPI.getInstance(context, BuildConfig.MIXPANEL_TOKEN)


 override fun dependencies() = emptyList<Class<out Initializer<*>>>()
}


/** Initializes Room DB — depends on nothing, safe to defer */
class DatabaseInitializer : Initializer<AppDatabase> {
 override fun create(context: Context): AppDatabase =
 Room.databaseBuilder(context.applicationContext, AppDatabase::class.java, "app-db")
 .fallbackToDestructiveMigration()
 .build()


 override fun dependencies() = emptyList<Class<out Initializer<*>>>()
}


/** Initializes Facebook SDK — heavy, definitely defer */
class FacebookInitializer : Initializer<Unit> {
 override fun create(context: Context) {
 FacebookSdk.sdkInitialize(context)
 }


 override fun dependencies() = emptyList<Class<out Initializer<*>>>()
}
Key Takeaways
- Profile first, optimize second. Use Android Studio Profiler or Perfetto to find actual bottlenecks before writing a single line of optimization code.
- Application.onCreate() is not a dumping ground. Move every non-critical SDK initialization out of it using the App Startup library or coroutine-based deferred init.
- Baseline Profiles are a free 30–40% win for apps distributed through the Play Store. Generate them and ship them; it takes under an hour to set up.
- windowBackground costs nothing and fixes the perceived blank screen for every cold start. There is no reason not to do this.
- Flat ConstraintLayout hierarchies reduce layout inflation time more than most developers expect, especially on mid-range devices.
- Measure with Macrobenchmark in CI so you catch startup regressions before they ship to users.
- DataStore over SharedPreferences eliminates synchronous disk reads from the main thread during startup.
Conclusion
Android app startup performance is not a one-time fix; it is an ongoing discipline. As your app adds features, new SDKs, and more complex screens, startup time will creep back up unless you actively measure and maintain it.
The good news: with the tools and techniques in this guide, you have a complete playbook. Start with profiling, apply the App Startup library and lazy init pattern, generate a Baseline Profile for your release build, and set up Macrobenchmark as a regression gate in your CI pipeline.
Your users will not see the work you put in, and that is exactly the point. A fast app feels native, responsive, and trustworthy. It keeps users coming back.
References
- Android Docs App Startup Time
- Jetpack App Startup Library
- Baseline Profiles Guide
- Macrobenchmark Library
- Android Studio Profiler
- DataStore vs SharedPreferences
- ViewStub Documentation
- Android Vitals Play Console
- ConstraintLayout Performance