

Sending a notification is only the beginning. Mobile teams also need to know whether it reached the intended devices, whether users opened it, and whether it supported the action the message was meant to drive.
Push analytics provides that visibility. It turns notification activity into a measurable funnel, helping teams separate delivery problems from weak engagement or a poor post-open experience.
This guide explains the push metrics that matter, how to calculate rates consistently, and how to interpret reporting without drawing conclusions the data cannot support.
What push analytics can tell you
Useful push analytics answers three questions: Did the notification reach the device? Did the user open it? Did the user complete the intended action?
These questions should not be compressed into one success metric. A notification can have strong delivery but weak engagement, or many opens but few completed actions. The most useful analysis follows the complete path and identifies where performance changes.
The push notification funnel
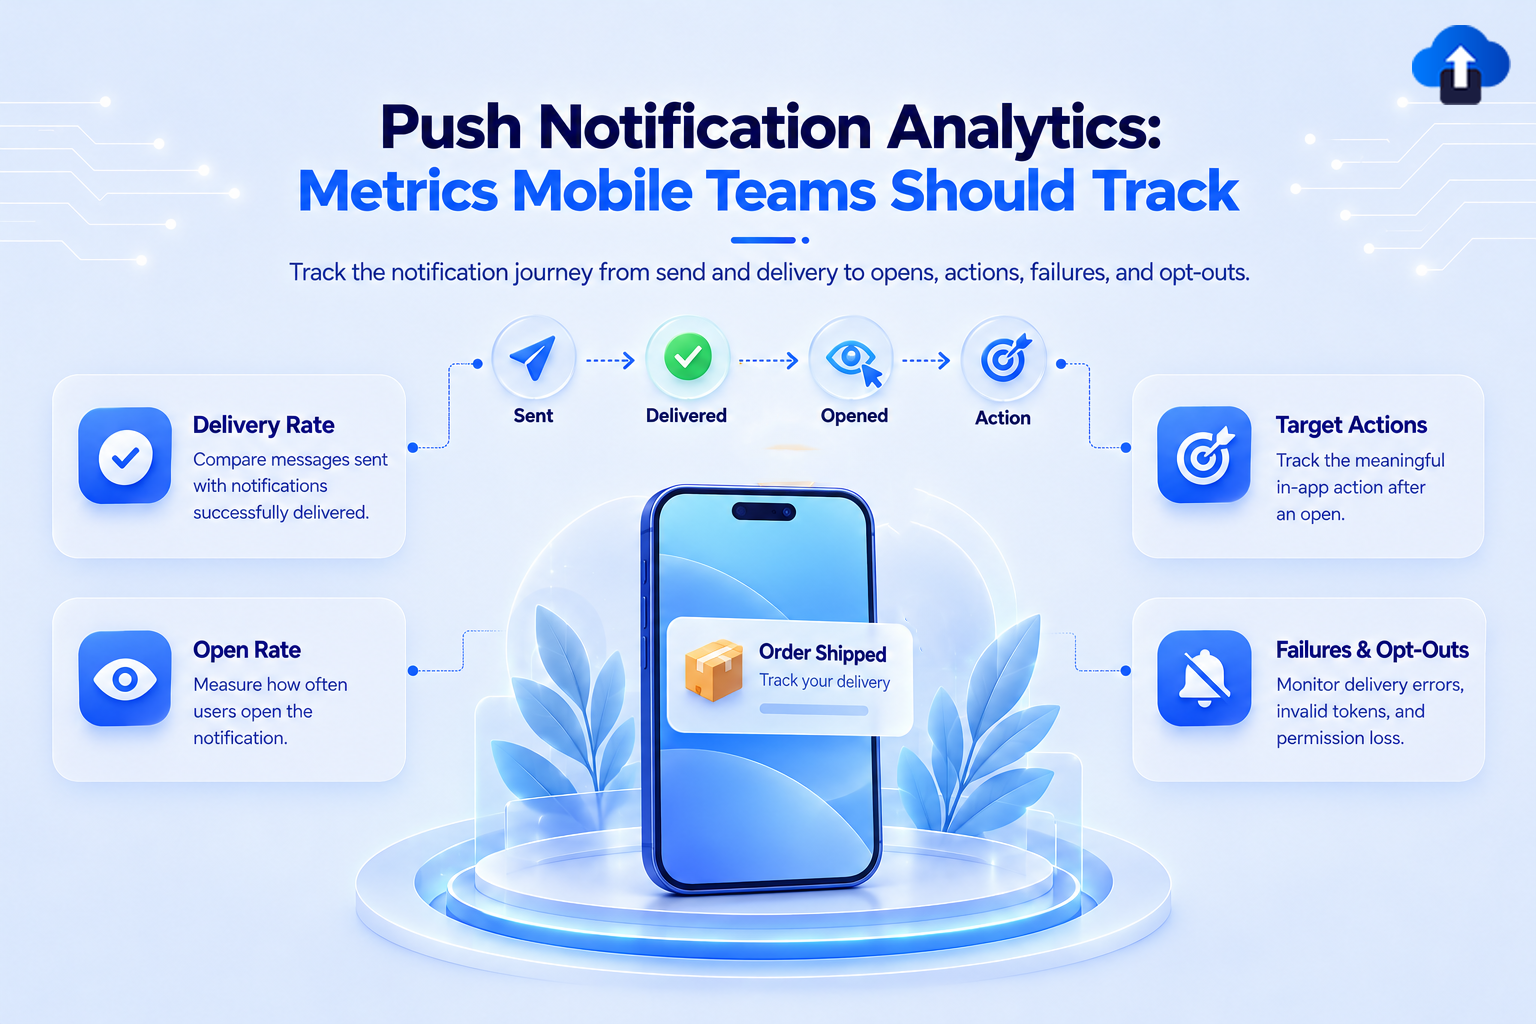
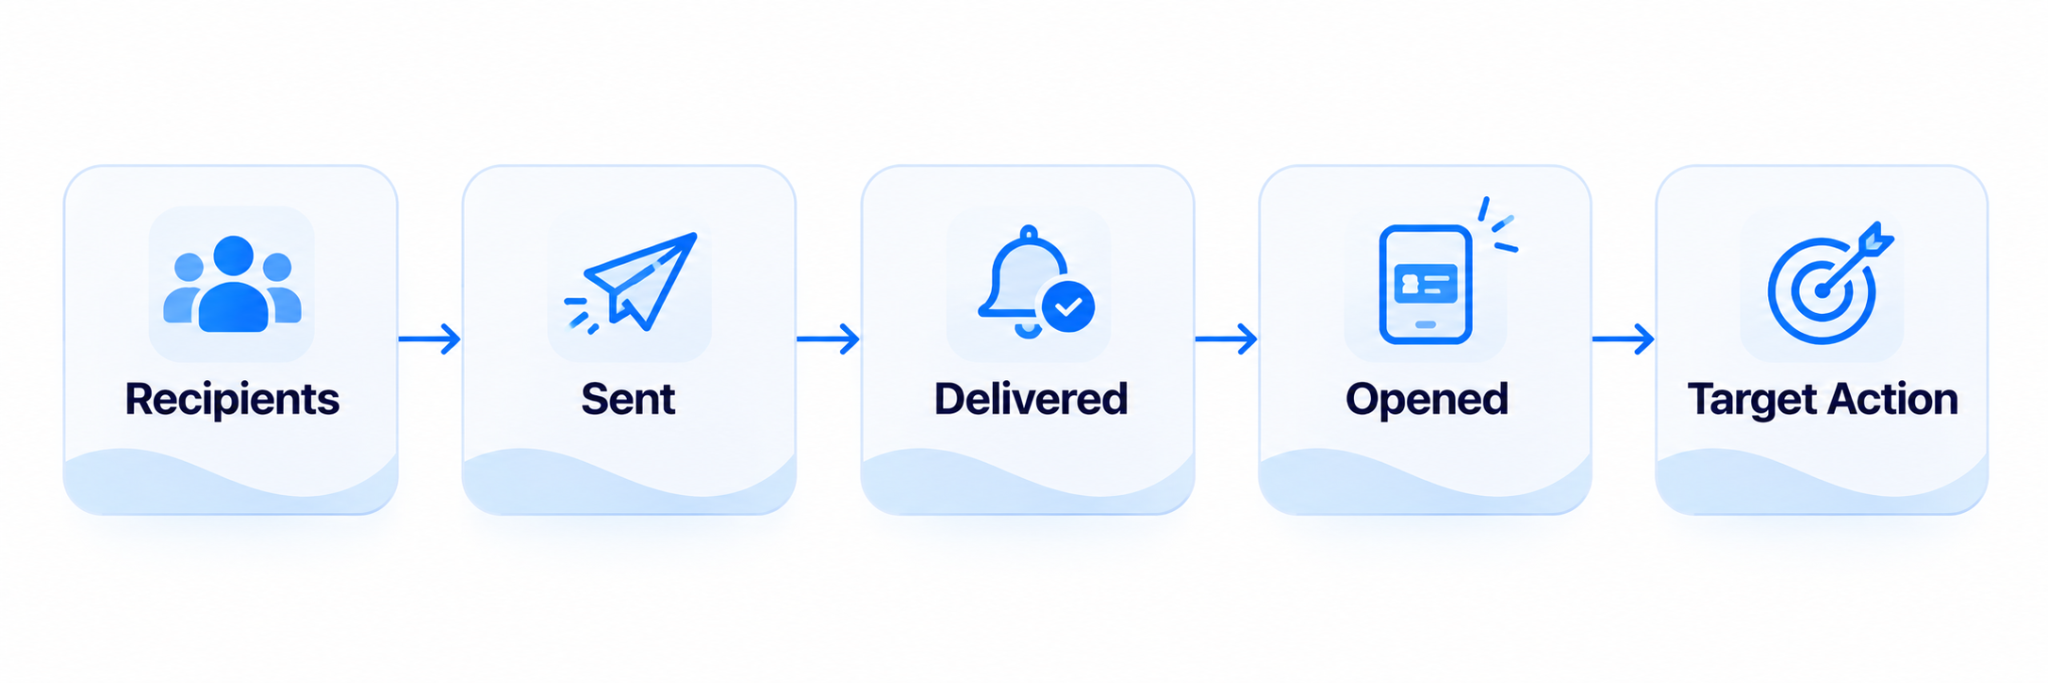
A practical push analytics funnel contains five stages:
Recipients → Sent → Delivered → Opened → Target action
- Recipients are the subscribed devices or users matched by the audience rules.
- Sent indicates that messages were accepted for delivery by the relevant push service.
- Delivered indicates that delivery was confirmed according to the provider’s reporting method.
- Opened records users who tapped the notification and opened the app.
- Target action is the product or business outcome, such as viewing an order, completing a purchase, confirming a booking, or reading a message.
The first four stages normally come from push reporting. The target action usually comes from product analytics. Connecting both sources gives teams a more complete view than open rate alone.
Push metrics mobile teams should track
The following push metrics provide a useful baseline for campaign and operational reporting.
Review raw counts before rates, then break push analytics down by platform, message type, audience segment, app version, or language when supported.
Compare similar sends with similar sends. A security alert and a promotion should not share the same definition of success.
How to calculate delivery, open, and action rates
Rates become useful only when the denominator is explicit and consistent.
Delivery rate
Delivery rate = Delivered ÷ Sent × 100This rate shows the share of sent messages confirmed as delivered. Do not calculate it from total recipients unless that denominator is clearly labelled, because some matched recipients may never enter the sent stage.
Open rate
Open rate = Opened ÷ Delivered × 100Using delivered messages shows engagement among notifications known to have reached a device. Some tools instead divide opens by sent messages. Either method can support internal reporting, but its label and denominator must stay consistent.
Action rate
Two action-rate calculations can answer different questions:
Completed actions ÷ Delivered × 100measures the overall result among reached devices.
Completed actions ÷ Opened × 100measures the post-open experience among engaged users.
Name each rate clearly because push analytics becomes misleading when denominators change without explanation.
How to diagnose gaps in the funnel
The location of a drop usually tells the team where to investigate first.
Recipients to sent
A large difference may reflect audience eligibility, subscription status, invalid records, or send-processing rules. Check how the platform defines a recipient and which devices qualify at send time.
Sent to delivered
This gap points towards delivery rather than message appeal. Review failure details and platform breakdowns for invalid tokens, connectivity, expiry, or provider rejection before changing the copy.
Delivered to opened
If delivery is healthy but opens are weak, examine relevance, timing, audience selection, and clarity. Compare messages with the same purpose instead of applying one open-rate expectation to every notification.
For additional guidance, review these push notification best practices.
Opened to target action
Strong opens with weak outcomes often indicate a mismatch after the tap. Confirm that the deep link opens the correct screen, the destination matches the message, and the action is easy to complete.
Push reporting limitations to understand
Push reporting is useful, but its metrics are not universal definitions.
First, sent is not the same as delivered. Firebase defines a send as a message enqueued for delivery or successfully passed to a service such as APNs. Its available metrics also differ by platform and message context, and reporting can be delayed.
Second, delivery is not guaranteed. Apple states that its systems attempt timely delivery, but local and remote notification delivery is not guaranteed. Device state, network conditions, expiry settings, and platform behaviour can affect the result.
Third, an open is not always the right outcome. A delivery update or payment receipt may communicate its value on the notification surface, so low opens do not automatically mean failure.
Finally, push analytics cannot explain intent by itself. Use message purpose and in-app events alongside notification data, and document definitions so every team interprets the report consistently.
Measure notification performance with AppsOnAir
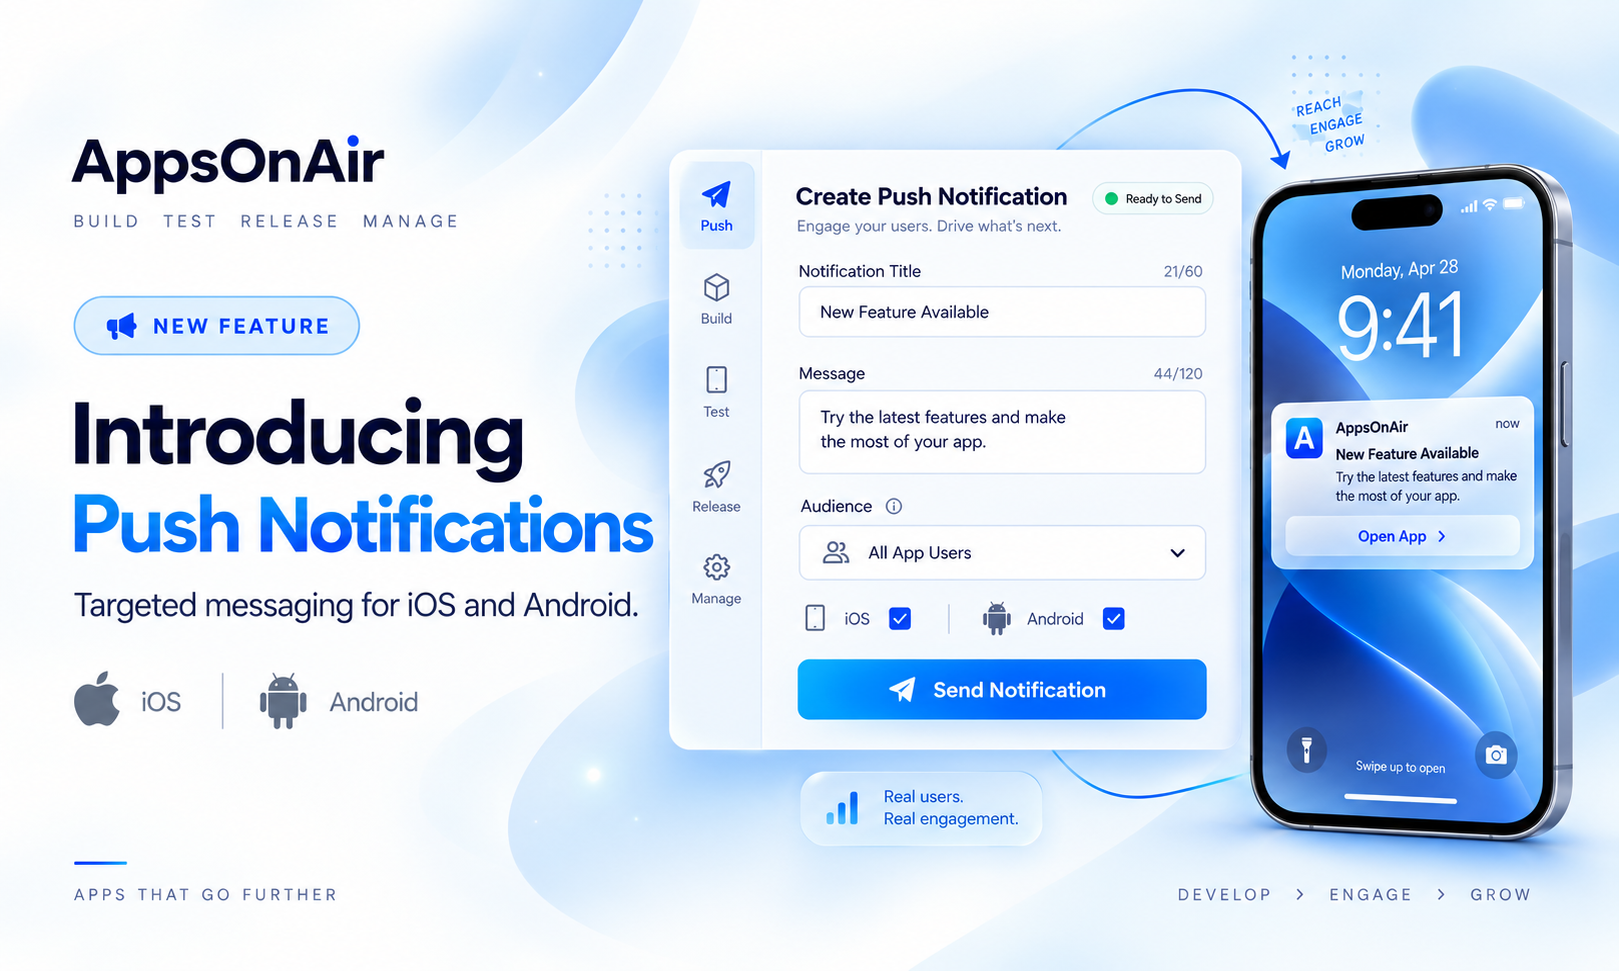
AppsOnAir Push Notification reports total recipients, sent, delivered, opened, and failed for each send. Teams can also inspect send details and platform-level performance to locate the stage where results changed.
Teams can target subscribed users, reusable segments, or filters based on tags, language, country, and session activity. This allows push analytics to be reviewed for relevant audiences instead of only as an account-wide average.
To measure purchases, bookings, content views, or other business outcomes, connect the notification to the corresponding event in your product analytics and preserve a consistent campaign identifier.
Explore AppsOnAir Push Notifications.
Common push analytics mistakes
- Treating sent as delivered: A send request only confirms that the message entered the delivery process.
- Changing the denominator: An open rate based on delivered cannot be compared directly with one based on sent.
- Optimising only for opens: Pair engagement with the relevant in-app outcome.
- Comparing unlike notifications: Compare similar message types, audiences, and platforms.
- Assuming zero taps means zero value: Some notifications complete their job by displaying useful information.
Frequently asked questions
What is push analytics?
Push analytics measures notification delivery, engagement, and outcomes, from the targeted audience through the intended action.
Which push metric is most important?
There is no single metric for every notification. Delivery rate reflects channel health, open rate reflects tap engagement, and action rate measures the intended outcome.
What is a good push notification open rate?
There is no universal rate for every app or message. Results depend on message type, audience, platform, permission status, metric definition, and denominator. Use comparable sends from your own app as the baseline.
Is a delivered notification the same as an opened notification?
No. Delivered means the message reached the device according to the reporting method. Opened means the user tapped it and opened the app.
Final thoughts
Effective push analytics follows the full notification journey. Track recipients, sent, delivered, opened, and the target action.
Keep denominators consistent, compare similar notifications, and account for platform-specific reporting limits. Connecting delivery data to in-app outcomes shows whether a problem belongs to the channel, message, audience, or post-tap experience.